Results maps
 1995 results map
 1999 results map
 2003 results map
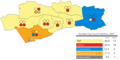 2007 results map
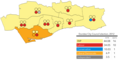 2012 results map
 2017 results map
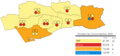 2022 results map
Dundee City Council in Scotland holds elections every five years, previously holding them every four years from its creation as a single-tier authority in 1995 to 2007.
| Year | SNP | Labour | Liberal [a] | Conservative | Residents Association | Independent |
|---|---|---|---|---|---|---|
| 1974 | 0 | 22 | 0 | 18 | 0 | 3 [b] |
| 1977 | 0 | 20 | 21 | 0 | 1 | 2 [b] |
| 1980 [c] | 0 | 25 | 0 | 17 | 1 | 1 [d] |
| 1984 | 2 | 25 | 2 | 15 | 0 | 0 |
| 1988 | 4 | 30 | 0 | 10 | 0 | 0 |
| 1992 | 6 | 26 | 0 | 12 | 0 | 0 |
| Year | SNP | Labour | Liberal Democrats | Conservative | Independent |
|---|---|---|---|---|---|
| 1995 | 3 | 28 | 0 | 4 | 1 |
| 1999 [a] | 10 | 14 | 0 | 4 | 1 [b] |
| 2003 | 11 | 10 | 5 | 2 | 1 |
| 2007 [c] | 13 | 10 | 3 | 2 | 1 |
| 2012 | 16 | 10 | 1 | 1 | 1 |
| 2017 | 14 | 9 | 2 | 3 | 1 |
| 2022 | 15 | 9 | 4 | 1 | 0 |


| Party | Candidate | FPv% | Count | ||||
|---|---|---|---|---|---|---|---|
| 1 | 2 | 3 | 4 | ||||
| SNP | Alan Ross | 48.9 | 2,005 | 2,020 | 2,028 | 2,055 | |
| Labour | George McIrvine | 34.0 | 1,395 | 1,412 | 1,432 | 1,448 | |
| Liberal Democrats | Christopher Hall | 10.6 | 435 | 437 | 446 | 500 | |
| Conservative | Martyn Geddes | 3.8 | 154 | 156 | 161 | ||
| Solidarity | Neil Bell | 1.4 | 57 | 65 | |||
| Scottish Socialist | Alan Albert Graham | 1.3 | 55 | ||||
| SNP hold | |||||||
| Valid: 4,071 Spoilt: 40 Quota: 2,051 Turnout: 4,101 | |||||||
| Party | Candidate | FPv% | Count | ||||||
|---|---|---|---|---|---|---|---|---|---|
| 1 | 2 | 3 | 4 | 5 | 6 | ||||
| SNP | Craig Melville | 47.6 | 1,550 | 1,551 | 1,557 | 1,571 | 1,620 | 1,747 | |
| Labour | George McIrvine | 31.1 | 1,013 | 1,018 | 1,021 | 1,031 | 1,052 | 1,189 | |
| Liberal Democrats | Chris Hall | 10.9 | 354 | 356 | 362 | 367 | 455 | ||
| Conservative | Colin Stewart | 6.9 | 224 | 226 | 237 | 241 | |||
| Scottish Socialist | Angela Gorrie | 1.6 | 52 | 52 | 55 | ||||
| Independent | Grant Simmons | 1.1 | 35 | 48 | |||||
| Independent | Dave Young | 0.9 | 28 | ||||||
| SNP hold | |||||||||
| Valid: 2,607 Spoilt: 34 Quota: 1,629 Turnout: 3,290 | |||||||||
| Party | Candidate | FPv% | Count | |||
|---|---|---|---|---|---|---|
| 1 | 2 | 3 | ||||
| SNP | Lynne Short | 49.5 | 1,383 | 1,389 | 1,399 | |
| Labour | Alan Cowan | 22.7 | 634 | 637 | 648 | |
| Conservative | James Clancy | 10.5 | 294 | 304 | 317 | |
| TUSC | Stuart Fairweather | 5.1 | 142 | 147 | 161 | |
| Scottish Green | Jacob Ellis | 4.1 | 116 | 118 | 123 | |
| Liberal Democrats | Christopher McIntyre | 3.0 | 85 | 87 | 92 | |
| Independent | Brian McLeod | 2.6 | 73 | 81 | ||
| UKIP | Calum Walker | 2.5 | 69 | |||
| SNP hold | ||||||
| Valid: 2,796 Spoilt: 28 Quota: 1,399 Turnout: 2,824 | ||||||
| Party | Candidate | FPv% | Count | ||||||
|---|---|---|---|---|---|---|---|---|---|
| 1 | 2 | 3 | 4 | 5 | 6 | ||||
| SNP | Steven Rome | 46.9 | 1,507 | 1,510 | 1,534 | 1,555 | 1,576 | 2,045 | |
| Labour | Jim Malone | 38.1 | 1,224 | 1,229 | 1,248 | 1,284 | 1,388 | ||
| Conservative | Robert Lindsay | 8.4 | 271 | 274 | 280 | 290 | |||
| TUSC | Michael Taylor | 2.8 | 91 | 109 | 122 | ||||
| Scottish Green | Alison Orr | 2.4 | 77 | 82 | |||||
| Citizens First | Roger Keech | 1.4 | 45 | ||||||
| SNP gain from Labour | |||||||||
| Valid: 3,215 Spoilt: 31 Quota: 1,608 Turnout: 3,246 | |||||||||
| Party | Candidate | FPv% | Count | |||||||
|---|---|---|---|---|---|---|---|---|---|---|
| 1 | 2 | 3 | 4 | 5 | 6 | 7 | ||||
| SNP | Lee Mills | 37.3 | 1,203 | 1,211 | 1,226 | 1,292 | 1,369 | 1,390 | 1,742 | |
| Labour | Marty Smith | 35.6 | 1,148 | 1,167 | 1,211 | 1,236 | 1,285 | 1,357 | ||
| Conservative | Calum Walker | 6.8 | 219 | 230 | 258 | 268 | 284 | |||
| Scottish Green | Katie Treharne | 5.5 | 176 | 190 | 217 | 238 | ||||
| Alba | Alan Ross | 5.5 | 178 | 204 | 212 | |||||
| Liberal Democrats | Outi Bourke | 4.8 | 156 | 171 | ||||||
| Workers Party | John Reddy | 4.4 | 143 | |||||||
| SNP gain from Labour | ||||||||||
| Valid: 3,223 Spoilt: 31 Quota: 1,612 Turnout: 3,254 | ||||||||||
| Party | Candidate | FPv% | Count | ||||||
|---|---|---|---|---|---|---|---|---|---|
| 1 | 2 | 3 | 4 | 5 | 6 | ||||
| SNP | Jimmy Black | 35.0 | 1,188 | 1,205 | 1,260 | 1,274 | 1,426 | 1,835 | |
| Liberal Democrats | Jenny Blain | 26.9 | 912 | 932 | 963 | 1,016 | 1,394 | ||
| Labour | Richard McCready | 26.9 | 911 | 929 | 947 | 972 | |||
| Conservative | Naveed Ali | 4.2 | 143 | 145 | 150 | ||||
| Scottish Green | Callum Baird | 3.6 | 121 | 134 | |||||
| TUSC | Donald Macleod | 3.4 | 116 | ||||||
| SNP hold | |||||||||
| Valid: 3,432 Spoilt: 41 Quota: 1,696 Turnout: 3,473 | |||||||||