
In probability theory and statistics, a normal distribution or Gaussian distribution is a type of continuous probability distribution for a real-valued random variable. The general form of its probability density function is

In probability theory and statistics, the exponential distribution or negative exponential distribution is the probability distribution of the distance between events in a Poisson point process, i.e., a process in which events occur continuously and independently at a constant average rate; the distance parameter could be any meaningful mono-dimensional measure of the process, such as time between production errors, or length along a roll of fabric in the weaving manufacturing process. It is a particular case of the gamma distribution. It is the continuous analogue of the geometric distribution, and it has the key property of being memoryless. In addition to being used for the analysis of Poisson point processes it is found in various other contexts.

In probability theory and statistics, the Weibull distribution is a continuous probability distribution. It models a broad range of random variables, largely in the nature of a time to failure or time between events. Examples are maximum one-day rainfalls and the time a user spends on a web page.

In probability theory and statistics, the Laplace distribution is a continuous probability distribution named after Pierre-Simon Laplace. It is also sometimes called the double exponential distribution, because it can be thought of as two exponential distributions spliced together along the abscissa, although the term is also sometimes used to refer to the Gumbel distribution. The difference between two independent identically distributed exponential random variables is governed by a Laplace distribution, as is a Brownian motion evaluated at an exponentially distributed random time. Increments of Laplace motion or a variance gamma process evaluated over the time scale also have a Laplace distribution.
In probability theory and mathematical physics, a random matrix is a matrix-valued random variable—that is, a matrix in which some or all of its entries are sampled randomly from a probability distribution. Random matrix theory (RMT) is the study of properties of random matrices, often as they become large. RMT provides techniques like mean-field theory, diagrammatic methods, the cavity method, or the replica method to compute quantities like traces, spectral densities, or scalar products between eigenvectors. Many physical phenomena, such as the spectrum of nuclei of heavy atoms, the thermal conductivity of a lattice, or the emergence of quantum chaos, can be modeled mathematically as problems concerning large, random matrices.
In probability theory the hypoexponential distribution or the generalized Erlang distribution is a continuous distribution, that has found use in the same fields as the Erlang distribution, such as queueing theory, teletraffic engineering and more generally in stochastic processes. It is called the hypoexponetial distribution as it has a coefficient of variation less than one, compared to the hyper-exponential distribution which has coefficient of variation greater than one and the exponential distribution which has coefficient of variation of one.
In Bayesian statistics, the Jeffreys prior is a non-informative prior distribution for a parameter space. Named after Sir Harold Jeffreys, its density function is proportional to the square root of the determinant of the Fisher information matrix:
In probability theory, the inverse Gaussian distribution is a two-parameter family of continuous probability distributions with support on (0,∞).
In probability theory and statistics, the normal-gamma distribution is a bivariate four-parameter family of continuous probability distributions. It is the conjugate prior of a normal distribution with unknown mean and precision.
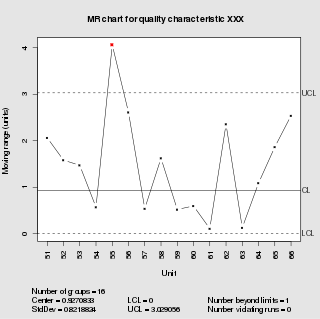
In statistical quality control, the individual/moving-range chart is a type of control chart used to monitor variables data from a business or industrial process for which it is impractical to use rational subgroups.

In queueing theory, a discipline within the mathematical theory of probability, an M/M/1 queue represents the queue length in a system having a single server, where arrivals are determined by a Poisson process and job service times have an exponential distribution. The model name is written in Kendall's notation. The model is the most elementary of queueing models and an attractive object of study as closed-form expressions can be obtained for many metrics of interest in this model. An extension of this model with more than one server is the M/M/c queue.
In probability and statistics, the Tweedie distributions are a family of probability distributions which include the purely continuous normal, gamma and inverse Gaussian distributions, the purely discrete scaled Poisson distribution, and the class of compound Poisson–gamma distributions which have positive mass at zero, but are otherwise continuous. Tweedie distributions are a special case of exponential dispersion models and are often used as distributions for generalized linear models.

In probability theory and statistics, the Conway–Maxwell–Poisson distribution is a discrete probability distribution named after Richard W. Conway, William L. Maxwell, and Siméon Denis Poisson that generalizes the Poisson distribution by adding a parameter to model overdispersion and underdispersion. It is a member of the exponential family, has the Poisson distribution and geometric distribution as special cases and the Bernoulli distribution as a limiting case.
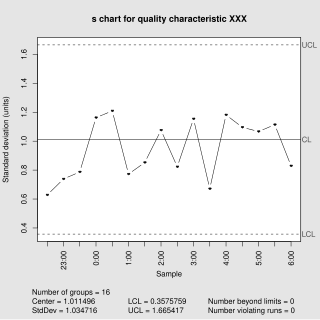
In statistical quality control, the and s chart is a type of control chart used to monitor variables data when samples are collected at regular intervals from a business or industrial process. This is connected to traditional statistical quality control (SQC) and statistical process control (SPC). However, Woodall noted that "I believe that the use of control charts and other monitoring methods should be referred to as “statistical process monitoring,” not “statistical process control (SPC).”"
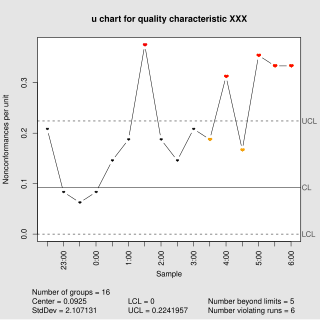
In statistical quality control, a u-chart is a type of control chart used to monitor "count"-type data where the sample size is greater than one, typically the average number of nonconformities per unit.

In probability theory and statistics, the Poisson distribution is a discrete probability distribution that expresses the probability of a given number of events occurring in a fixed interval of time if these events occur with a known constant mean rate and independently of the time since the last event. It can also be used for the number of events in other types of intervals than time, and in dimension greater than 1.

In probability theory and directional statistics, a wrapped exponential distribution is a wrapped probability distribution that results from the "wrapping" of the exponential distribution around the unit circle.
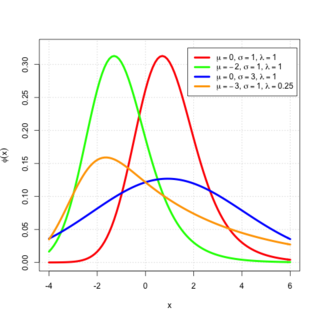
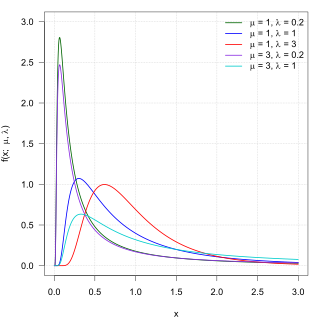
In probability theory, an exponentially modified Gaussian distribution describes the sum of independent normal and exponential random variables. An exGaussian random variable Z may be expressed as Z = X + Y, where X and Y are independent, X is Gaussian with mean μ and variance σ2, and Y is exponential of rate λ. It has a characteristic positive skew from the exponential component.
In queueing theory, a discipline within the mathematical theory of probability, the M/M/∞ queue is a multi-server queueing model where every arrival experiences immediate service and does not wait. In Kendall's notation it describes a system where arrivals are governed by a Poisson process, there are infinitely many servers, so jobs do not need to wait for a server. Each job has an exponentially distributed service time. It is a limit of the M/M/c queue model where the number of servers c becomes very large.
Response modeling methodology (RMM) is a general platform for statistical modeling of a linear/nonlinear relationship between a response variable (dependent variable) and a linear predictor (a linear combination of predictors/effects/factors/independent variables), often denoted the linear predictor function. It is generally assumed that the modeled relationship is monotone convex (delivering monotone convex function) or monotone concave (delivering monotone concave function). However, many non-monotone functions, like the quadratic equation, are special cases of the general model.


