Solar Energy Generating Systems (SEGS) in California, with the combined capacity from three separate locations at 354 megawatts, is now the world's second largest solar thermal energy generating facility, after the commissioning of the even larger Ivanpah facility in 2014. It consists of nine solar power plants in California's Mojave Desert, where insolation is among the best available in the United States. SEGS I–II (44 MW) are located at Daggett, SEGS III–VII (150 MW) are installed at Kramer Junction, and SEGS VIII–IX (160 MW) are placed at Harper Lake. NextEra Energy Resources operates and partially owns the plants located at Kramer Junction. On January 26, 2018, the SEGS VIII and IX at Harper Lake were sold to renewable energy company Terra-Gen, LLC. A tenth plant had been in construction and SEGS XI and SEGS XII had been planned by Luz Industries, but the developer filed for bankruptcy in 1992, because it was unable to secure construction financing.
Primary energy (PE) is an energy form found in nature that has not been subjected to any human engineered conversion process. It is energy contained in raw fuels, and other forms of energy received as input to a system. Primary energy can be non-renewable or renewable.

Columbia Generating Station is a nuclear commercial energy facility located 10 miles (16 km) north of Richland, Washington. It is owned and operated by Energy Northwest, a Washington state, not-for-profit joint operating agency. Licensed by the Nuclear Regulatory Commission in 1983, Columbia first produced electricity in May 1984, and entered commercial operation in December 1984.
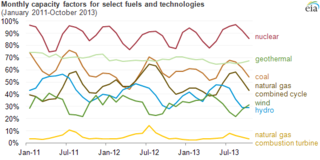
The net capacity factor is the unitless ratio of an actual electrical energy output over a given period of time to the maximum possible electrical energy output over that period. The capacity factor is defined for any electricity producing installation, such as a fuel consuming power plant or one using renewable energy, such as wind or the sun. The average capacity factor can also be defined for any class of such installations, and can be used to compare different types of electricity production.
Electric energy consumption is the form of energy consumption that uses electric energy. Electric energy consumption is the actual energy demand made on existing electricity supply.
The United States was the second-largest energy consumer in 2010 after China. The country is ranked seventh in energy consumption per-capita after Canada and several small nations. Not included is the significant amount of energy used overseas in the production of retail and industrial goods consumed in the United States.
World energy consumption is the total energy used by the entire human civilization. Typically measured per year, it involves all energy harnessed from every energy source applied towards humanity's endeavours across every single industrial and technological sector, across every country. It does not include energy from food, and the extent to which direct biomass burning has been accounted for is poorly documented. Being the power source metric of civilization, World Energy Consumption has deep implications for humanity's socio-economic-political sphere.
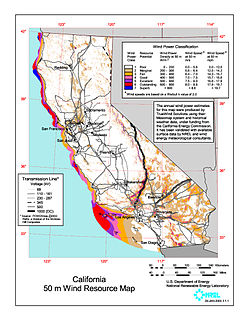
Wind power has a long history in the state of California, with the initiative and early development occurring during Governor Jerry Brown's first two terms in the late 1970s and early 1980s. California's wind power capacity has grown by nearly 350% since 2001, when it was less than 1,700 MW. In 2016, wind energy now supplies about 6.9% of California's total electricity needs, or enough to power more than 1.3 million households. Most of California's wind generation is found in the Tehachapi area of Kern County, California, with some big projects in Solano, Contra Costa and Riverside counties as well. California is among the states with the largest amount of installed wind power capacity. In recent years, California has lagged behind other states when it comes to the installation of wind power. It was ranked 4th overall for wind power electrical generation at the end of 2016 behind Texas, Iowa, and Oklahoma. As of December 31, 2016, California had 5,662 megawatts (MW) of wind powered electricity generating capacity.

Coal power in the United States accounted for 39% of the country's electricity production at utility-scale facilities in 2014, 33% in 2015, 30.4% in 2016 and 27.4% in 2018 Coal supplied 12.6 quadrillion BTUs of primary energy to electric power plants in 2017, which made up 91% of coal's contribution to US energy supply. Utilities buy more than 90% of the coal consumed in the United States.
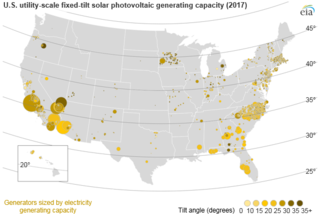
Solar power in the United States includes utility-scale solar power plants as well as local distributed generation, mostly from rooftop photovoltaics. As of the end of 2017, the United States had over 50 gigawatts (GW) of installed photovoltaic capacity. In the twelve months through December 2018, utility scale solar power generated 66.6 terawatt-hours (TWh), 1.66% of total U.S. electricity. During the same time period total solar generation, including estimated small scale Generation photovoltaic generation, was 96.1 TWh, 2.30% of total U.S. electricity. In terms of total cumulative installed capacity, by year end 2017 the United States ranked 2nd in the world behind China. In 2016, 39% of all new electricity generation capacity in the country came from solar, more than any other source and ahead of natural gas (29%). By 2015, solar employment had overtaken oil and gas as well as coal employment in the United States. In 2016, more than 260,000 Americans were employed in the solar industry.

The Solana Generating Station is a solar power plant near Gila Bend, Arizona, about 70 miles (110 km) southwest of Phoenix, completed in 2013. When commissioned it was the largest parabolic trough plant in the world and the first U.S. solar plant with molten salt thermal energy storage. Built by the Spanish company Abengoa Solar, it has a total capacity of 280 megawatts (MW) gross, from two 140 MW gross (125 MW net) steam turbine generators, which is enough to power 70,000 homes while avoiding around 475,000 tons of CO2 every year. Its name is the Spanish term for "sunny spot".

Wind power in Illinois provided 6.2% of the state's generated electrical power in 2017 and 8.3% of electrical power sales. At the end of 2017, Illinois had 4,464 megawatts (MW) of wind power installed, ranking sixth among states for installed wind turbine capacity.
The distinct ways of electricity generation can incur significantly different costs. Calculations of these costs can be made at the point of connection to a load or to the electricity grid. The cost is typically given per kilowatt-hour or megawatt-hour. It includes the initial capital, discount rate, as well as the costs of continuous operation, fuel, and maintenance. This type of calculation assists policymakers, researchers and others to guide discussions and decision making.
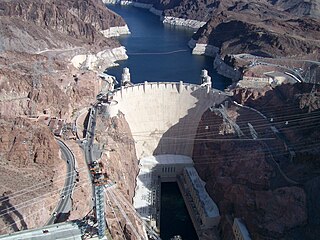
Hydroelectric power stations in the United States are currently the largest renewable source of energy, but the second for nominal capacity. Hydroelectric power produced 35% of the total renewable electricity in the U.S. in 2015, and 6.1% of the total U.S. electricity.

The US state of Colorado has vast wind energy resources and the installed electricity capacity and generation from wind power in Colorado has been growing significantly in recent years. The growth has been sustained due to a combination of falling costs, continuing federal incentives, and the state's aggressive renewable portfolio standard that requires 30% of the state's electricity to come from renewable sources by 2020.
California is the most populous state in the nation, but its total energy demand is second to the state of Texas. The state has one of the lowest per capita energy consumption rates in the country due in part to the relatively mild weather comparative to the rest of the nation.
The U.S. state of Arkansas is a significant producer of natural gas and a minor producer of petroleum.