
Economic growth can be defined as the increase or improvement in the inflation-adjusted market value of the goods and services produced by an economy in a financial year. Statisticians conventionally measure such growth as the percent rate of increase in the real gross domestic product, or real GDP.

In economics, income distribution covers how a country's total GDP is distributed amongst its population. Economic theory and economic policy have long seen income and its distribution as a central concern. Unequal distribution of income causes economic inequality which is a concern in almost all countries around the world.
Income inequality metrics or income distribution metrics are used by social scientists to measure the distribution of income and economic inequality among the participants in a particular economy, such as that of a specific country or of the world in general. While different theories may try to explain how income inequality comes about, income inequality metrics simply provide a system of measurement used to determine the dispersion of incomes. The concept of inequality is distinct from poverty and fairness.

Engel's law is an economic relationship proposed by the statistician Ernst Engel in 1857. Even though Engel's law was proposed roughly 160 years ago, it holds relevance today in the context of poverty, especially the reduction of poverty. For instance, the lines and rates for national poverty are often determined by the food share of household expenditure.
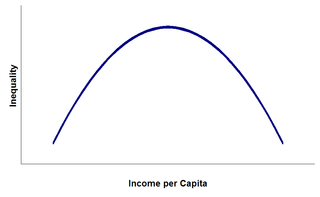
The Kuznets curve expresses a hypothesis advanced by economist Simon Kuznets in the 1950s and 1960s. According to this hypothesis, as an economy develops, market forces first increase and then decrease economic inequality. The Kuznets curve appeared to be consistent with experience at the time it was proposed. However, since the 1960s, inequality has risen in the US and other developed countries.

Development geography is a branch of geography which refers to the standard of living and its quality of life of its human inhabitants. In this context, development is a process of change that affects peoples' lives. It may involve an improvement in the quality of life as perceived by the people undergoing change. However, development is not always a positive process. Gunder Frank commented on the global economic forces that lead to the development of underdevelopment. This is covered in his dependency theory.

International inequality refers to inequality between countries, as compared to global inequality, which is inequality between people across countries. International inequality research has primarily been concentrated on the rise of international income inequality, but other aspects include educational and health inequality, as well as differences in medical access. Reducing inequality within and among countries is the 10th goal of the UN Sustainable Development Goals and ensuring that no one is left behind is central to achieving them. Inequality can be measured by metrics such as the Gini coefficient.

Poverty is measured in different ways by different bodies, both governmental and nongovernmental. Measurements can be absolute, which references a single standard, or relative, which is dependent on context. Poverty is widely understood to be multidimensional, comprising social, natural and economic factors situated within wider socio-political processes. The capabilities approach argues that capturing the perceptions of poor people is fundamental to understanding poverty.

In China today, poverty refers mainly to the rural poor. Decades of economic development has reduced urban extreme poverty. According to the World Bank, more than 850 million Chinese people have been lifted out of extreme poverty; China's poverty rate fell from 88 percent in 1981 to 0.7 percent in 2015, as measured by the percentage of people living on the equivalent of US$1.90 or less per day in 2011 purchasing price parity terms, which still stands in 2022. The Chinese definition of extreme poverty is more stringent than that of the World Bank: earning less than $2.30 a day at purchasing power parity (PPP), Since the start of far-reaching economic reforms in the late 1970s, growth has fuelled a substantial increase in per-capita income lifting people out of extreme poverty. China's per capita income has increased fivefold between 1990 and 2000, from $200 to $1,000. Between 2000 and 2010, per capita income also rose at the same rate, from $1,000 to $5,000, moving China into the ranks of middle-income countries. Between 1990 and 2005, China's progress accounted for more than three-quarters of global poverty reduction and was largely responsible for the world reaching the UN millennium development target of dividing extreme poverty in half. This can be attributed to a combination of a rapidly expanding labour market, driven by a protracted period of economic growth, and a series of government transfers such as an urban subsidy, and the introduction of a rural pension. The World Bank Group said that the percentage of the population living below the international poverty line of $1.9 fell to 0.7 percent in 2015, and poverty line of $3.2 fell to 7% in 2015. At the end of 2018, the number of people living below China's national poverty line of ¥2,300 (CNY) per year was 16.6 million, equal to 1.7% of the population at the time.

Redistribution of income and wealth is the transfer of income and wealth from some individuals to others through a social mechanism such as taxation, welfare, public services, land reform, monetary policies, confiscation, divorce or tort law. The term typically refers to redistribution on an economy-wide basis rather than between selected individuals.

The causes of poverty may vary with respect to nation, region, and in comparison with other countries at the global level. Yet, there is a commonality amongst these causes. Philosophical perspectives, and especially historical perspectives, including some factors at a micro and macro level can be considered in understanding these causes.
Bangladesh is a developing nation. Despite rapid economic growth, poverty remains a major issue. However, poverty has declined sharply in recent history. Shortly after its independence, approximately 90% of the population lived under the poverty line. However, since economic reforms and trade liberalization of early 1990s, along with accelerated economic growth since early-2000s, Bangladesh have experienced a dramatic progress in reducing poverty. The remarkable progress in poverty alleviation has been recognized by international institutions. According to World Bank, more than 33 million Bangladeshi people have been lifted out of poverty since 2000; as measured by the percentage of people living on the equivalent of US$1.90 or less per day in 2011 purchasing price parity terms.
Though resource rich, Bolivia is one of the poorest countries in Latin America. In the 1980s the tin market collapsed, the currency dived, and inflation soared. Austerity measures restored some confidence, but at the cost of widening inequality. This was exacerbated when, at the behest of the US, coca growing, a prime source of income for the poor, was shut down. There are also tensions over natural gas deposits, perhaps Bolivia's last remaining resource. And while GDP and GNI have both grown significantly since 2000, severe disparities exist both regionally and ethnically. UNICEF reports that women and children are the most vulnerable group. In 2002, the percentage of the population living below the poverty line was 82% in rural areas and 54% in urban areas. The departments with the most poverty are Potosi, Chuquisaca and Pando, while Santa Cruz and Tarija have the least.
Tax policy and economic inequality in the United States discusses how tax policy affects the distribution of income and wealth in the United States. Income inequality can be measured before- and after-tax; this article focuses on the after-tax aspects. Income tax rates applied to various income levels and tax expenditures primarily drive how market results are redistributed to impact the after-tax inequality. After-tax inequality has risen in the United States markedly since 1980, following a more egalitarian period following World War II.

According to official government statistics, in 2021, the Philippine poverty rate rose to 18.1%, or roughly 19.99 million Filipinos, after the COVID-19 pandemic hampered years of government poverty reduction efforts; this was higher than the 16.6% or 17.67 million recorded in 2018 but lower than the 25.2% poverty rate recorded in 2012.
Extreme poverty is defined as living on less than US$2.50 purchasing power parity. Uganda has made significant progress in eradicating poverty and achieved the first millennium development goal of halving the number of people in extreme poverty. Uganda was listed as the 9th most successful country in Africa as regards poverty eradication. The percentage of Ugandans living in absolute poverty has been on a substantial decline, and the finance ministry in the country projected that the extreme poverty level will be reduced to 10% in the future. This success has been attributed to the deliberate efforts to combat poverty in the country by numerous national strategies that are explained below.
The Galor-Zeira model is the first macroeconomic model to explore the role of heterogeneity in the determination of macroeconomic behavior. In contrast to the representative agent approach that dominated the field of macroeconomics till the early 1990s and argued that heterogeneity has no impact on macroeconomic activity, the model demonstrates that in the presence of capital markets imperfections and local non-convexities in the production of human capital, income distribution affects the long run level of income per-capita as well as the growth process.
In developmental economics, the Poverty-Growth-Inequality Triangle refers to the idea that a country's change in poverty can be fully determined by its change in income growth and income inequality. According to the model, a development strategy must then also be based on income growth and income inequality. The Poverty-Growth-Inequality Triangle model was created by François Bourguignon, the former Chief Economist (2003-2007) of the World Bank.

Effects of income inequality, researchers have found, include higher rates of health and social problems, and lower rates of social goods, a lower population-wide satisfaction and happiness and even a lower level of economic growth when human capital is neglected for high-end consumption. For the top 21 industrialised countries, counting each person equally, life expectancy is lower in more unequal countries. A similar relationship exists among US states.
Kenya is a lower-middle income economy. Although Kenya's economy is the largest and most developed in eastern and central Africa, 16.1% (2023/2024) of its population lives below the international poverty line. This severe poverty is mainly caused by economic inequality, government corruption and health problems. In turn, poverty also worsens these factors. Fortunately, Kenya's government has made many efforts to address the issue of poverty, and it has received significant help from international institutions as well. The incident rate of poverty has steadily decreased, as shown by a recent MPI index. However, the end to poverty in Kenya was due to some long-term efforts.
