DOT is a graph description language, developed as a part of the Graphviz project. DOT graphs are typically stored as files with the .gv or .dot filename extension — .gv is preferred, to avoid confusion with the .dot extension used by versions of Microsoft Word before 2007. dot is also the name of the main program to process DOT files in the Graphviz package.
OPeNDAP is an acronym for "Open-source Project for a Network Data Access Protocol," an endeavor focused on enhancing the retrieval of remote, structured data through a Web-based architecture and a discipline-neutral Data Access Protocol (DAP). Widely used, especially in Earth science, the protocol is layered on HTTP, and its current specification is DAP4, though the previous DAP2 version remains broadly used. Developed and advanced by the non-profit OPeNDAP, Inc., DAP is intended to enable remote, selective data-retrieval as an easily invoked Web service. OPeNDAP, Inc. also develops and maintains zero-cost (reference) implementations of the DAP protocol in both server-side and client-side software.
A GIS software program is a computer program to support the use of a geographic information system, providing the ability to create, store, manage, query, analyze, and visualize geographic data, that is, data representing phenomena for which location is important. The GIS software industry encompasses a broad range of commercial and open-source products that provide some or all of these capabilities within various information technology architectures.
GRIB is a concise data format commonly used in meteorology to store historical and forecast weather data. It is standardized by the World Meteorological Organization's Commission for Basic Systems, known under number GRIB FM 92-IX, described in WMO Manual on Codes No.306. Currently there are three versions of GRIB. Version 0 was used to a limited extent by projects such as TOGA, and is no longer in operational use. The first edition is used operationally worldwide by most meteorological centers, for Numerical Weather Prediction output (NWP). A newer generation has been introduced, known as GRIB second edition, and data is slowly changing over to this format. Some of the second-generation GRIB is used for derived products distributed in the Eumetcast of Meteosat Second Generation. Another example is the NAM model.

The Visualization Toolkit (VTK) is a free software system for 3D computer graphics, image processing and scientific visualization.
SpeedTree is a group of vegetation programming and modeling software products developed and sold by Interactive Data Visualization, Inc. (IDV) that generates virtual foliage for animations, architecture and in real time for video games and demanding real time simulations.
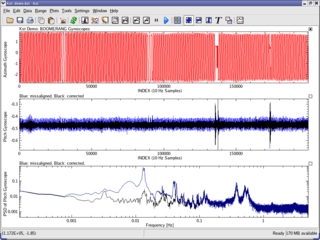
Kst is a plotting and data viewing program. It is a general purpose plotting software program that evolved out of a need to visualize and analyze astronomical data, but has also found subsequent use in the real time display of graphical information. Kst is a KDE application and is freely available for anyone to download and use under the terms of the GPL. It is noted for being able to graph real-time data acquisition.
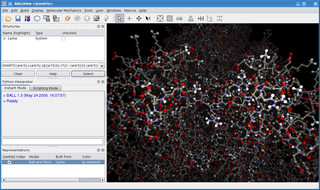
BALL is a C++ class framework and set of algorithms and data structures for molecular modelling and computational structural bioinformatics, a Python interface to this library, and a graphical user interface to BALL, the molecule viewer BALLView.
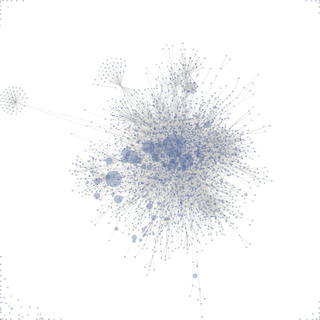
Prefuse is a Java-based toolkit for building interactive information visualization applications. It supports a rich set of features for data modeling, visualization and interaction. It provides optimized data structures for tables, graphs, and trees, a host of layout and visual encoding techniques, and support for animation, dynamic queries, integrated search, and database connectivity.

Rogue Wave Software was an American software development company based in Louisville, Colorado. It provided cross-platform software development tools and embedded components for parallel, data-intensive, and other high-performance computing (HPC) applications.
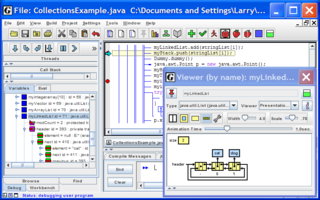
jGRASP is a development environment that includes the automatic creation of software visualizations. It produces static visualizations of source code structure and visualizations of data structures at runtime.
NetCDF is a set of software libraries and self-describing, machine-independent data formats that support the creation, access, and sharing of array-oriented scientific data. The project homepage is hosted by the Unidata program at the University Corporation for Atmospheric Research (UCAR). They are also the chief source of netCDF software, standards development, updates, etc. The format is an open standard. NetCDF Classic and 64-bit Offset Format are an international standard of the Open Geospatial Consortium.
Web-based simulation (WBS) is the invocation of computer simulation services over the World Wide Web, specifically through a web browser. Increasingly, the web is being looked upon as an environment for providing modeling and simulation applications, and as such, is an emerging area of investigation within the simulation community.

Fiji is an open source image processing package based on ImageJ2.

Integrated Genome Browser (IGB) is an open-source genome browser, a visualization tool used to observe biologically-interesting patterns in genomic data sets, including sequence data, gene models, alignments, and data from DNA microarrays.

MeVisLab is a cross-platform application framework for medical image processing and scientific visualization. It includes advanced algorithms for image registration, segmentation, and quantitative morphological and functional image analysis. An IDE for graphical programming and rapid user interface prototyping is available.

The KDE Gear is a set of applications and supporting libraries that are developed by the KDE community, primarily used on Linux-based operating systems but mostly multiplatform, and released on a common release schedule.