
JavaScript, often abbreviated as JS, is a programming language and core technology of the Web, alongside HTML and CSS. 99% of websites use JavaScript on the client side for webpage behavior.
A JavaScript library is a library of pre-written JavaScript code that allows for easier development of JavaScript-based applications, especially for AJAX and other web-centric technologies. They can be included in a website by embedding it directly in the HTML via a script tag.

Ext JS is a JavaScript application framework for building interactive cross-platform web applications using techniques such as Ajax, DHTML and DOM scripting. It can be used as a simple component framework but also as a full framework for building single-page applications (SPAs).
This is a comparison of web frameworks for front-end web development that are heavily reliant on JavaScript code for their behavior.

WebGL is a JavaScript API for rendering interactive 2D and 3D graphics within any compatible web browser without the use of plug-ins. WebGL is fully integrated with other web standards, allowing GPU-accelerated usage of physics, image processing, and effects in the HTML canvas. WebGL elements can be mixed with other HTML elements and composited with other parts of the page or page background.

Away3D is an open-source platform for developing interactive 3D graphics for video games and applications, in Adobe Flash or HTML5. The platform consists of a 3D world editor, a 3D graphics engine, a 3D physics engine and a compressed 3D model file format (AWD).
Ajax Animator is a free, web-based animation suite. Its development began in March 2006 by Antimatter15, then a sixth grader. Ajax Animator was originally intended to be a free replacement to Flash MX, but is now a general-purpose animation tool. Ajax Animator is primarily written using JavaScript, the Ext JS framework, and HTML5-related technologies such as SVG. The software can be used either from within a web browser or from an offline installation.

Three.js is a cross-browser JavaScript library and application programming interface (API) used to create and display animated 3D computer graphics in a web browser using WebGL. The source code is hosted in a repository on GitHub.
D3.js is a JavaScript library for producing dynamic, interactive data visualizations in web browsers. It makes use of Scalable Vector Graphics (SVG), HTML5, and Cascading Style Sheets (CSS) standards. It is the successor to the earlier Protovis framework. Its development was noted in 2011, as version 2.0.0 was released in August 2011. With the release of version 4.0.0 in June 2016, D3 was changed from a single library into a collection of smaller, modular libraries that can be used independently.
There are different JavaScript charting libraries available. Below is a comparison of which features are available in each.

Plotly is a technical computing company headquartered in Montreal, Quebec, that develops online data analytics and visualization tools. Plotly provides online graphing, analytics, and statistics tools for individuals and collaboration, as well as scientific graphing libraries for Python, R, MATLAB, Perl, Julia, Arduino, JavaScript and REST.

Jeremy Ashkenas is a computer programmer known for the creation and co-creation of the CoffeeScript and LiveScript programming languages respectively, the Backbone.js JavaScript framework and the Underscore.js JavaScript library. While working in the graphics department at The New York Times, he shared the 2015 Gerald Loeb Award for Images/Graphics/Interactives. After working at the Times, he was an employee of Observable, Inc. As of 2020, he works at Substack Inc. Jeremy returned to The New York Times in June 2022 as Director of Graphics for Opinion.
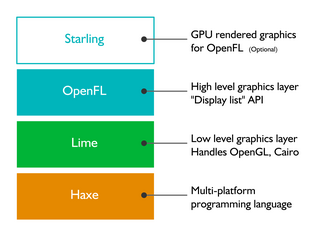
OpenFL is a free and open-source software framework and platform for the creation of multi-platform applications and video games. OpenFL applications can be written in Haxe, JavaScript, or TypeScript, and may be published as standalone applications for several targets including iOS, Android, HTML5, Windows, macOS, Linux, WebAssembly, Flash, AIR, PlayStation 4, PlayStation 3, PlayStation Vita, Xbox One, Wii U, TiVo, Raspberry Pi, and Node.js.
This is a list of articles related to the JavaScript programming language.

Babylon.js is a JavaScript library and 3D engine for displaying real time 3D graphics in a web browser via HTML5. The source code is available on GitHub and distributed under the Apache License 2.0.

Chart.js is a free, open-source JavaScript library for data visualization, which supports eight chart types: bar, line, area, pie (doughnut), bubble, radar, polar, and scatter. Created by London-based web developer Nick Downie in 2013, now it is maintained by the community and is the second most popular JavaScript charting library on GitHub by the number of stars after D3.js, considered significantly easier to use though less customizable than the latter. Chart.js renders in HTML5 canvas and is widely covered as one of the best data visualization libraries. It is available under the MIT license.
AnyChart is a JavaScript library for cross-platform data visualization in the form of interactive charts and dashboards. It was initially available as a Flash chart component and integrated as such by Oracle in APEX.