
Peripheral vision, or indirect vision, is vision as it occurs outside the point of fixation, i.e. away from the center of gaze or, when viewed at large angles, in the "corner of one's eye". The vast majority of the area in the visual field is included in the notion of peripheral vision. "Far peripheral" vision refers to the area at the edges of the visual field, "mid-peripheral" vision refers to medium eccentricities, and "near-peripheral", sometimes referred to as "para-central" vision, exists adjacent to the center of gaze.
Visual acuity (VA) commonly refers to the clarity of vision, but technically rates a person's ability to recognize small details with precision. Visual acuity depends on optical and neural factors. Optical factors of the eye influence the sharpness of an image on its retina. Neural factors include the health and functioning of the retina, of the neural pathways to the brain, and of the interpretative faculty of the brain.
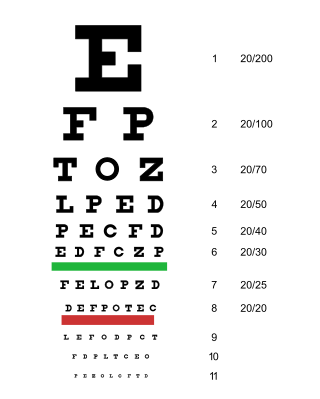
A Snellen chart is an eye chart that can be used to measure visual acuity. Snellen charts are named after the Dutch ophthalmologist Herman Snellen who developed the chart in 1862 as a measurement tool for the acuity formula developed by his professor Franciscus Cornelis Donders. Many ophthalmologists and vision scientists now use an improved chart known as the LogMAR chart.
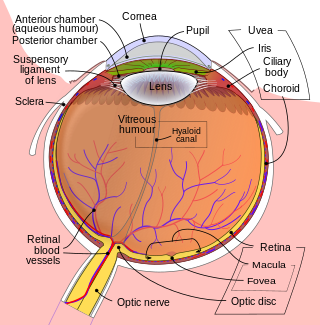
The fovea centralis is a small, central pit composed of closely packed cones in the eye. It is located in the center of the macula lutea of the retina.
An eye chart, or optotype, is a chart used to subjectively measure visual acuity. Eye charts are often used by health care professionals, such as optometrists, physicians or nurses, to screen persons for vision impairment. Ophthalmologists, physicians who specialize in the eye, also use eye charts to monitor the visual acuity of their patients in response to various therapies such as medications or surgery.
An eye examination is a series of tests performed to assess vision and ability to focus on and discern objects. It also includes other tests and examinations pertaining to the eyes. Eye examinations are primarily performed by an optometrist, ophthalmologist, or an orthoptist. Health care professionals often recommend that all people should have periodic and thorough eye examinations as part of routine primary care, especially since many eye diseases are asymptomatic.

The LEA Vision Test System is a series of pediatric vision tests designed specifically for children who do not know how to read the letters of the alphabet that are typically used in eye charts. There are numerous variants of the LEA test which can be used to assess the visual capabilities of near vision and distance vision, as well as several other aspects of occupational health, such as contrast sensitivity, visual field, color vision, visual adaptation, motion perception, and ocular function and accommodation (eye).

In optics, defocus is the aberration in which an image is simply out of focus. This aberration is familiar to anyone who has used a camera, videocamera, microscope, telescope, or binoculars. Optically, defocus refers to a translation of the focus along the optical axis away from the detection surface. In general, defocus reduces the sharpness and contrast of the image. What should be sharp, high-contrast edges in a scene become gradual transitions. Fine detail in the scene is blurred or even becomes invisible. Nearly all image-forming optical devices incorporate some form of focus adjustment to minimize defocus and maximize image quality.

Contrast is the contradiction in luminance or colour that makes an object distinguishable. In visual perception of the real world, contrast is determined by the difference in the colour and brightness of the object and other objects within the same field of view. The human visual system is more sensitive to contrast than absolute luminance; we can perceive the world similarly regardless of the huge changes in illumination over the day or from place to place. The maximum contrast of an image is the contrast ratio or dynamic range. Images with a contrast ratio close to their medium's maximum possible contrast ratio experience a conservation of contrast, wherein any increase in contrast in some parts of the image must necessarily result in a decrease in contrast elsewhere. Brightening an image will increase contrast in dark areas but decrease contrast in bright areas, while darkening the image will have the opposite effect. Bleach bypass destroys contrast in both the darkest and brightest parts of an image while enhancing luminance contrast in areas of intermediate brightness.

An E chart, also known as a tumbling E chart, is an ophthalmological chart used to measure a patient's visual acuity.

The Golovin–Sivtsev table is a standardized table for testing visual acuity, which was developed in 1923 by Soviet ophthalmologists Sergei Golovin and D. A. Sivtsev. In the USSR, it was the most common table of its kind, and as of 2008 its use is still widespread in several post-Soviet states.

Sloan letters, designed by Louise Sloan in 1959, are a set of optotypes used to test visual acuity generally used in Snellen charts and logMAR charts.
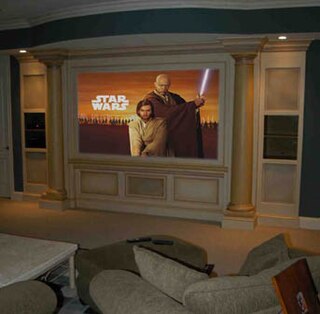
Optimum HDTV viewing distance is the distance that provides the viewer with the optimum immersive visual HDTV experience.
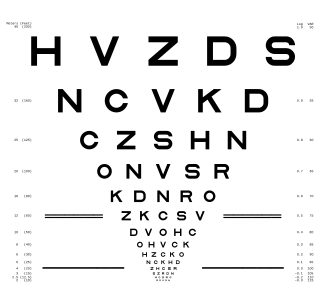
A logMAR chart is a chart consisting of rows of letters that is used by ophthalmologists, orthoptists, optometrists, and vision scientists to estimate visual acuity. The chart was developed at the National Vision Research Institute of Australia in 1976, and is designed to enable a more accurate estimate of acuity than do other charts. For this reason, the LogMAR chart is recommended, particularly in a research setting.
The sharpness of our senses is defined by the finest detail we can discriminate. Visual acuity is measured by the smallest letters that can be distinguished on a chart and is governed by the anatomical spacing of the mosaic of sensory elements on the retina. Yet spatial distinctions can be made on a finer scale still: misalignment of borders can be detected with a precision up to 10 times better than visual acuity, as already shown by Ewald Hering in 1899. This hyperacuity, transcending by far the size limits set by the retinal 'pixels', depends on sophisticated information processing in the brain.
Stereoscopic acuity, also stereoacuity, is the smallest detectable depth difference that can be seen in binocular vision.

Spaceflight-associated neuro-ocular syndrome (SANS), previously known as Spaceflight-induced visual impairment, is hypothesized to be a result of increased intracranial pressure (ICP). The study of visual changes and ICP in astronauts on long-duration flights is a relatively recent topic of interest to space medicine professionals. Although reported signs and symptoms have not appeared to be severe enough to cause blindness in the near term, long term consequences of chronically elevated intracranial pressure are unknown.
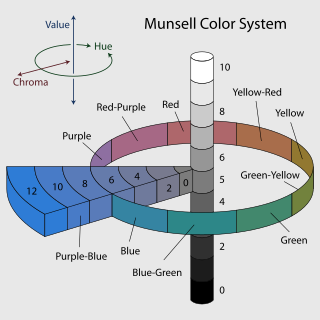
The Farnsworth–Munsell 100 Hue Color Vision test is a color vision test often used to test for color blindness. The system was developed by Dean Farnsworth in the 1940s and it tests the ability to isolate and arrange minute differences in various color targets with constant value and chroma that cover all the visual hues described by the Munsell color system. There are several variations of the test, one featuring 100 color hues and one featuring 15 color hues. Originally taken in an analog environment with physical hue tiles, the test is now taken from computer consoles. An accurate quantification of color vision accuracy is particularly important to designers, photographers and colorists, who all rely on accurate color vision to produce quality content.

Vernier acuity is a type of visual acuity – more precisely of hyperacuity – that measures the ability to discern a disalignment among two line segments or gratings. A subject's vernier acuity is the smallest visible offset between the stimuli that can be detected. Because the disalignments are often much smaller than the diameter and spacing of retinal receptors, vernier acuity requires neural processing and "pooling" to detect it. Because vernier acuity exceeds acuity by far, the phenomenon has been termed hyperacuity. Vernier acuity develops rapidly during infancy and continues to slowly develop throughout childhood. At approximately three to twelve months old, it surpasses grating acuity in foveal vision in humans. However, vernier acuity decreases more quickly than grating acuity in peripheral vision. Vernier acuity was first explained by Ewald Hering in 1899, based on earlier data by Alfred Volkmann in 1863 and results by Ernst Anton Wülfing in 1892.

Louise Littig Sloan was an American ophthalmologist and vision scientist. She is credited for being a pioneer of the sub-division of clinical vision research, contributing more than 100 scientific articles in which she either authored or co-authored. Her most notable work was in the area of visual acuity testing where she developed and improved equipment. Sloan received her Ph.D. from Bryn Mawr College in experimental psychology. She spent a short period of time in both Bryn Mawr's experimental psychology program as well as the Department of Ophthalmology at Harvard Medical School. The majority of her career, however, was spent at Johns Hopkins Wilmer Eye Institute where she directed the Wilmer Laboratory of Physiological Optics for 44 years. In 1971, Sloan was the second woman awarded the prestigious Edgar D. Tillyer Award by Optica (formerly Optical Society for her many achievements in the field of vision.

