List of alpine climate locations

Last updated

A number of locations around the Earth have alpine climate. The climate of some of these locations is described, below.

For tropical oceanic locations, such as the summit of Mauna Loa, elev. 13,679 ft (4,169 m), the temperature is roughly constant throughout the year:

Climate data for Mauna Loa slope observatory (1961–1990), extremes 1955–2012
MonthJanFebMarAprMayJunJulAugSepOctNovDecYear
Record high °F (°C)67
(19)
85
(29)
65
(18)
67
(19)
68
(20)
71
(22)
70
(21)
68
(20)
67
(19)
66
(19)
65
(18)
67
(19)
85
(29)
Average high °F (°C)49.8
(9.9)
49.6
(9.8)
50.2
(10.1)
51.8
(11.0)
53.9
(12.2)
57.2
(14.0)
56.4
(13.6)
56.3
(13.5)
55.8
(13.2)
54.7
(12.6)
52.6
(11.4)
50.6
(10.3)
53.2
(11.8)
Average low °F (°C)33.3
(0.7)
32.9
(0.5)
33.2
(0.7)
34.6
(1.4)
36.6
(2.6)
39.4
(4.1)
38.8
(3.8)
38.9
(3.8)
38.5
(3.6)
37.8
(3.2)
36.2
(2.3)
34.3
(1.3)
36.2
(2.3)
Record low °F (°C)19
(−7)
18
(−8)
20
(−7)
24
(−4)
27
(−3)
28
(−2)
26
(−3)
28
(−2)
29
(−2)
27
(−3)
25
(−4)
22
(−6)
18
(−8)
Average precipitation inches (mm)2.3
(58)
1.5
(38)
1.7
(43)
1.3
(33)
1.0
(25)
0.5
(13)
1.1
(28)
1.5
(38)
1.3
(33)
1.1
(28)
1.7
(43)
2.0
(51)
17
(431)
Average snowfall inches (cm)0.0
(0.0)
1.0
(2.5)
0.3
(0.76)
1.3
(3.3)
0.0
(0.0)
0.0
(0.0)
0.0
(0.0)
0.0
(0.0)
0.0
(0.0)
0.0
(0.0)
0.0
(0.0)
1.0
(2.5)
3.6
(9.06)
Average precipitation days (≥ 0.01 inch)45654345555455
Source: NOAA, [1] WRCC [2]

For mid-latitude locations, such as Mount Washington in New Hampshire, the temperature varies seasonally, but never gets very warm:

Climate data for Mount Washington, elev. 6,267 ft (1,910.2 m) near the summit (1991–2020 normals, extremes 1933–present)
MonthJanFebMarAprMayJunJulAugSepOctNovDecYear
Record high °F (°C)48
(9)
48
(9)
54
(12)
60
(16)
66
(19)
72
(22)
71
(22)
72
(22)
69
(21)
62
(17)
52
(11)
47
(8)
72
(22)
Mean maximum °F (°C)38.7
(3.7)
35.6
(2.0)
40.8
(4.9)
49.0
(9.4)
58.8
(14.9)
64.5
(18.1)
65.4
(18.6)
64.2
(17.9)
61.4
(16.3)
53.8
(12.1)
45.8
(7.7)
39.8
(4.3)
67.2
(19.6)
Average high °F (°C)14.9
(−9.5)
14.8
(−9.6)
20.8
(−6.2)
30.7
(−0.7)
42.5
(5.8)
51.4
(10.8)
55.3
(12.9)
54.2
(12.3)
49.1
(9.5)
37.7
(3.2)
28.4
(−2.0)
20.1
(−6.6)
35.0
(1.7)
Daily mean °F (°C)5.8
(−14.6)
5.9
(−14.5)
12.9
(−10.6)
23.7
(−4.6)
36.3
(2.4)
45.5
(7.5)
49.9
(9.9)
48.7
(9.3)
43.1
(6.2)
31.3
(−0.4)
20.8
(−6.2)
11.8
(−11.2)
28.0
(−2.2)
Average low °F (°C)−3.2
(−19.6)
−3.0
(−19.4)
4.9
(−15.1)
16.7
(−8.5)
30.2
(−1.0)
39.6
(4.2)
44.5
(6.9)
43.2
(6.2)
37.1
(2.8)
24.9
(−3.9)
13.1
(−10.5)
3.5
(−15.8)
21.0
(−6.1)
Mean minimum °F (°C)−28.6
(−33.7)
−25.2
(−31.8)
−19.4
(−28.6)
−1.1
(−18.4)
14.0
(−10.0)
25.7
(−3.5)
34.4
(1.3)
31.4
(−0.3)
21.3
(−5.9)
8.3
(−13.2)
−5.8
(−21.0)
−20.8
(−29.3)
−32.3
(−35.7)
Record low °F (°C)−47
(−44)
−47
(−44)
−38
(−39)
−20
(−29)
−2
(−19)
8
(−13)
24
(−4)
20
(−7)
9
(−13)
−5
(−21)
−26
(−32)
−46
(−43)
−47
(−44)
Average precipitation inches (mm)5.74
(146)
5.45
(138)
6.72
(171)
7.31
(186)
7.68
(195)
8.59
(218)
8.93
(227)
7.72
(196)
7.66
(195)
9.99
(254)
8.09
(205)
7.35
(187)
91.23
(2,317)
Average snowfall inches (cm)41.4
(105)
43.3
(110)
46.2
(117)
33.1
(84)
12.9
(33)
1.3
(3.3)
0.0
(0.0)
0.1
(0.25)
1.2
(3.0)
19.0
(48)
35.6
(90)
47.7
(121)
281.8
(716)
Average extreme snow depth inches (cm)14.1
(36)
16.3
(41)
17.6
(45)
14.5
(37)
6.1
(15)
0.5
(1.3)
0.0
(0.0)
0.0
(0.0)
0.3
(0.76)
5.7
(14)
8.3
(21)
12.7
(32)
21.0
(53)
Average precipitation days (≥ 0.01 in)20.018.319.718.317.417.617.515.513.718.119.221.0216.3
Average snowy days (≥ 0.1 in)19.618.118.014.16.51.20.20.21.39.915.119.7123.9
Mean monthly sunshine hours 92.0106.9127.6143.2171.3151.3145.0130.5127.2127.182.483.11,487.6
Percent possible sunshine 32363435373331303437293033
Source 1: NOAA (sun 1961–1990) [3] [4] [5]
Source 2: Mount Washington Observatory (extremes 1933–present) [6] [7]

Other examples of alpine climate include

Kasprowy Wierch, Poland
Climate chart (explanation)
J
F
M
A
M
J
J
A
S
O
N
D
 
 
105
 
 
−5
−10
 
 
98
 
 
−5
−11
 
 
113
 
 
−3
−9
 
 
127
 
 
1
−4
 
 
186
 
 
6
1
 
 
208
 
 
10
4
 
 
248
 
 
12
6
 
 
172
 
 
12
6
 
 
159
 
 
8
2
 
 
123
 
 
4
−1
 
 
118
 
 
0
−5
 
 
108
 
 
−4
−9
Average max. and min. temperatures in °C
Precipitation totals in mm
Source: Institute of Meteorology and Water Management [8] [9] [10]
Imperial conversion
JFMAMJJASOND
 
 
4.1
 
 
24
14
 
 
3.9
 
 
23
13
 
 
4.4
 
 
26
16
 
 
5
 
 
34
25
 
 
7.3
 
 
43
33
 
 
8.2
 
 
50
39
 
 
9.8
 
 
54
43
 
 
6.8
 
 
54
44
 
 
6.2
 
 
46
36
 
 
4.9
 
 
39
30
 
 
4.6
 
 
32
23
 
 
4.2
 
 
26
16
Average max. and min. temperatures in °F
Precipitation totals in inches
Sněžka, Poland/Czech Republic
Climate chart (explanation)
J
F
M
A
M
J
J
A
S
O
N
D
 
 
107
 
 
−3
−8
 
 
89
 
 
−4
−9
 
 
88
 
 
−2
−7
 
 
51
 
 
3
−2
 
 
78
 
 
7
2
 
 
98
 
 
11
5
 
 
121
 
 
13
8
 
 
95
 
 
13
8
 
 
87
 
 
8
4
 
 
80
 
 
5
0
 
 
83
 
 
1
−4
 
 
114
 
 
−2
−7
Average max. and min. temperatures in °C
Precipitation totals in mm
Source: Institute of Meteorology and Water Management [8] [9] [10]
Imperial conversion
JFMAMJJASOND
 
 
4.2
 
 
26
17
 
 
3.5
 
 
25
17
 
 
3.5
 
 
29
20
 
 
2
 
 
37
28
 
 
3.1
 
 
45
36
 
 
3.9
 
 
51
42
 
 
4.7
 
 
55
46
 
 
3.8
 
 
55
46
 
 
3.4
 
 
47
39
 
 
3.1
 
 
40
32
 
 
3.3
 
 
34
25
 
 
4.5
 
 
28
19
Average max. and min. temperatures in °F
Precipitation totals in inches
Yu Shan, Taiwan
Climate chart (explanation)
J
F
M
A
M
J
J
A
S
O
N
D
 
 
83
 
 
4
−5
 
 
121
 
 
4
−4
 
 
139
 
 
5
−2
 
 
244
 
 
8
0
 
 
414
 
 
11
3
 
 
488
 
 
12
4
 
 
446
 
 
14
4
 
 
519
 
 
14
4
 
 
325
 
 
14
4
 
 
144
 
 
13
3
 
 
78
 
 
10
0
 
 
70
 
 
6
−3
Average max. and min. temperatures in °C
Precipitation totals in mm
Source: Central Weather Bureau [11]
Imperial conversion
JFMAMJJASOND
 
 
3.3
 
 
39
24
 
 
4.7
 
 
39
25
 
 
5.5
 
 
42
29
 
 
9.6
 
 
46
33
 
 
16
 
 
51
37
 
 
19
 
 
54
40
 
 
18
 
 
57
40
 
 
20
 
 
56
40
 
 
13
 
 
57
39
 
 
5.7
 
 
56
37
 
 
3.1
 
 
50
33
 
 
2.8
 
 
43
27
Average max. and min. temperatures in °F
Precipitation totals in inches
Mount Apo, Philippines
Climate chart (explanation)
J
F
M
A
M
J
J
A
S
O
N
D
 
 
51
 
 
11
2
 
 
41
 
 
12
2
 
 
38
 
 
12
3
 
 
45
 
 
13
4
 
 
82
 
 
12
4
 
 
108
 
 
11
4
 
 
114
 
 
10
4
 
 
120
 
 
10
4
 
 
95
 
 
11
4
 
 
96
 
 
11
4
 
 
76
 
 
11
4
 
 
52
 
 
11
3
Average max. and min. temperatures in °C
Precipitation totals in mm
Source: meteoblue.com [12]
Imperial conversion
JFMAMJJASOND
 
 
2
 
 
53
36
 
 
1.6
 
 
54
36
 
 
1.5
 
 
54
38
 
 
1.8
 
 
56
40
 
 
3.2
 
 
54
40
 
 
4.3
 
 
53
40
 
 
4.5
 
 
51
40
 
 
4.7
 
 
51
40
 
 
3.7
 
 
53
40
 
 
3.8
 
 
53
40
 
 
3
 
 
53
40
 
 
2
 
 
53
38
Average max. and min. temperatures in °F
Precipitation totals in inches
Phari, China
Climate chart (explanation)
J
F
M
A
M
J
J
A
S
O
N
D
 
 
5
 
 
1
−17
 
 
8.8
 
 
1
−15
 
 
22
 
 
4
−10
 
 
28
 
 
7
−6
 
 
31
 
 
10
−1
 
 
57
 
 
13
3
 
 
105
 
 
13
4
 
 
96
 
 
13
4
 
 
54
 
 
11
2
 
 
28
 
 
8
−5
 
 
4.5
 
 
5
−12
 
 
2.8
 
 
3
−16
Average max. and min. temperatures in °C
Precipitation totals in mm
Source: Weather China [13]
Imperial conversion
JFMAMJJASOND
 
 
0.2
 
 
34
1
 
 
0.3
 
 
35
5
 
 
0.9
 
 
39
13
 
 
1.1
 
 
45
22
 
 
1.2
 
 
50
30
 
 
2.2
 
 
55
37
 
 
4.1
 
 
55
40
 
 
3.8
 
 
55
39
 
 
2.1
 
 
53
35
 
 
1.1
 
 
47
23
 
 
0.2
 
 
42
11
 
 
0.1
 
 
38
3
Average max. and min. temperatures in °F
Precipitation totals in inches
La Rinconada, Peru
Climate chart (explanation)
J
F
M
A
M
J
J
A
S
O
N
D
 
 
135
 
 
8
−3
 
 
113
 
 
8
−3
 
 
106
 
 
8
−3
 
 
50
 
 
9
−5
 
 
19
 
 
9
−8
 
 
7
 
 
8
−12
 
 
6
 
 
8
−11
 
 
15
 
 
10
−10
 
 
34
 
 
10
−7
 
 
51
 
 
11
−6
 
 
67
 
 
10
−6
 
 
104
 
 
9
−3
Average max. and min. temperatures in °C
Precipitation totals in mm
Source: Climate-data.org [14]
Imperial conversion
JFMAMJJASOND
 
 
5.3
 
 
47
26
 
 
4.4
 
 
46
27
 
 
4.2
 
 
46
26
 
 
2
 
 
47
23
 
 
0.7
 
 
47
19
 
 
0.3
 
 
47
11
 
 
0.2
 
 
47
12
 
 
0.6
 
 
49
13
 
 
1.3
 
 
49
19
 
 
2
 
 
52
21
 
 
2.6
 
 
51
22
 
 
4.1
 
 
48
26
Average max. and min. temperatures in °F
Precipitation totals in inches
Nevado de Toluca, Mexico
Climate chart (explanation)
J
F
M
A
M
J
J
A
S
O
N
D
 
 
15
 
 
7
−3
 
 
13
 
 
8
−2
 
 
12
 
 
10
−1
 
 
56
 
 
10
0
 
 
116
 
 
10
0
 
 
205
 
 
9
1
 
 
244
 
 
8
1
 
 
228
 
 
8
0
 
 
208
 
 
8
0
 
 
88
 
 
8
0
 
 
27
 
 
7
−1
 
 
15
 
 
7
−2
Average max. and min. temperatures in °C
Precipitation totals in mm
Source: Servicio Meteorológico Nacional [15]
Imperial conversion
JFMAMJJASOND
 
 
0.6
 
 
45
28
 
 
0.5
 
 
46
28
 
 
0.5
 
 
49
31
 
 
2.2
 
 
50
32
 
 
4.6
 
 
50
33
 
 
8.1
 
 
49
33
 
 
9.6
 
 
47
33
 
 
9
 
 
47
33
 
 
8.2
 
 
47
33
 
 
3.5
 
 
46
31
 
 
1.1
 
 
45
29
 
 
0.6
 
 
45
28
Average max. and min. temperatures in °F
Precipitation totals in inches
Zugspitze, Germany
Climate chart (explanation)
J
F
M
A
M
J
J
A
S
O
N
D
 
 
172
 
 
−8
−13
 
 
160
 
 
−8
−14
 
 
228
 
 
−7
−12
 
 
179
 
 
−4
−9
 
 
161
 
 
1
−5
 
 
186
 
 
4
−2
 
 
188
 
 
6
1
 
 
182
 
 
6
1
 
 
145
 
 
3
−2
 
 
114
 
 
1
−5
 
 
179
 
 
−4
−10
 
 
188
 
 
−7
−12
Average max. and min. temperatures in °C
Precipitation totals in mm
Source: Météo Climat [16] [17]
Imperial conversion
JFMAMJJASOND
 
 
6.8
 
 
19
9
 
 
6.3
 
 
17
7
 
 
9
 
 
20
10
 
 
7
 
 
25
15
 
 
6.3
 
 
34
24
 
 
7.3
 
 
39
29
 
 
7.4
 
 
43
33
 
 
7.2
 
 
43
33
 
 
5.7
 
 
38
28
 
 
4.5
 
 
33
24
 
 
7
 
 
24
15
 
 
7.4
 
 
20
10
Average max. and min. temperatures in °F
Precipitation totals in inches
Cerro de Pasco, Peru
Climate chart (explanation)
J
F
M
A
M
J
J
A
S
O
N
D
 
 
137
 
 
12
1
 
 
151
 
 
11
1
 
 
153
 
 
11
1
 
 
80
 
 
13
0
 
 
43
 
 
12
−2
 
 
14
 
 
13
−4
 
 
16
 
 
13
−4
 
 
26
 
 
13
−3
 
 
52
 
 
12
−2
 
 
98
 
 
12
−1
 
 
103
 
 
13
−1
 
 
126
 
 
13
0
Average max. and min. temperatures in °C
Precipitation totals in mm
Source: Climate-data.org [18]
Imperial conversion
JFMAMJJASOND
 
 
5.4
 
 
53
33
 
 
5.9
 
 
52
34
 
 
6
 
 
53
33
 
 
3.1
 
 
55
31
 
 
1.7
 
 
54
28
 
 
0.6
 
 
55
25
 
 
0.6
 
 
55
25
 
 
1
 
 
55
26
 
 
2
 
 
54
29
 
 
3.9
 
 
54
31
 
 
4.1
 
 
55
31
 
 
5
 
 
55
32
Average max. and min. temperatures in °F
Precipitation totals in inches
Tanggulashan, China
Climate chart (explanation)
J
F
M
A
M
J
J
A
S
O
N
D
 
 
1.8
 
 
−6
−24
 
 
1.9
 
 
−4
−22
 
 
1.9
 
 
1
−17
 
 
5.3
 
 
5
−12
 
 
20
 
 
9
−6
 
 
60
 
 
13
0
 
 
81
 
 
15
2
 
 
65
 
 
14
2
 
 
44
 
 
11
−1
 
 
11
 
 
5
−10
 
 
1.1
 
 
−2
−19
 
 
1.2
 
 
−5
−24
Average max. and min. temperatures in °C
Precipitation totals in mm
Source: China Meteorological Administration [19]
Imperial conversion
JFMAMJJASOND
 
 
0.1
 
 
20
−12
 
 
0.1
 
 
25
−7
 
 
0.1
 
 
33
2
 
 
0.2
 
 
41
11
 
 
0.8
 
 
49
22
 
 
2.4
 
 
55
31
 
 
3.2
 
 
59
36
 
 
2.6
 
 
58
36
 
 
1.7
 
 
52
30
 
 
0.4
 
 
40
15
 
 
0
 
 
29
−2
 
 
0
 
 
22
−10
Average max. and min. temperatures in °F
Precipitation totals in inches
Piz Corvatsch, Switzerland
Climate chart (explanation)
J
F
M
A
M
J
J
A
S
O
N
D
 
 
78
 
 
−9
−14
 
 
69
 
 
−9
−14
 
 
76
 
 
−8
−13
 
 
106
 
 
−5
−10
 
 
132
 
 
−1
−6
 
 
144
 
 
3
−2
 
 
135
 
 
5
0
 
 
135
 
 
5
1
 
 
100
 
 
2
−3
 
 
121
 
 
−1
−5
 
 
135
 
 
−5
−10
 
 
88
 
 
−8
−13
Average max. and min. temperatures in °C
Precipitation totals in mm
Source: MeteoSwiss [20]
Imperial conversion
JFMAMJJASOND
 
 
3.1
 
 
17
8
 
 
2.7
 
 
15
6
 
 
3
 
 
18
9
 
 
4.2
 
 
22
14
 
 
5.2
 
 
30
22
 
 
5.7
 
 
37
29
 
 
5.3
 
 
42
32
 
 
5.3
 
 
42
33
 
 
3.9
 
 
35
27
 
 
4.8
 
 
30
22
 
 
5.3
 
 
22
14
 
 
3.5
 
 
18
9
Average max. and min. temperatures in °F
Precipitation totals in inches
White Mountain Peak, California, United States
Climate chart (explanation)
J
F
M
A
M
J
J
A
S
O
N
D
 
 
51
 
 
−5
−14
 
 
43
 
 
−5
−14
 
 
55
 
 
−4
−14
 
 
48
 
 
−2
−12
 
 
50
 
 
2
−7
 
 
21
 
 
8
−2
 
 
28
 
 
12
2
 
 
28
 
 
12
2
 
 
22
 
 
9
−1
 
 
26
 
 
4
−5
 
 
31
 
 
−1
−10
 
 
66
 
 
−4
−12
Average max. and min. temperatures in °C
Precipitation totals in mm
Source: The Western Regional Climate Center [21]
Imperial conversion
JFMAMJJASOND
 
 
2
 
 
23
7
 
 
1.7
 
 
23
7
 
 
2.2
 
 
24
7
 
 
1.9
 
 
28
10
 
 
2
 
 
36
19
 
 
0.8
 
 
46
29
 
 
1.1
 
 
54
36
 
 
1.1
 
 
53
35
 
 
0.9
 
 
48
30
 
 
1
 
 
40
23
 
 
1.2
 
 
31
15
 
 
2.6
 
 
25
10
Average max. and min. temperatures in °F
Precipitation totals in inches

Related Research Articles

<span class="mw-page-title-main">Zakopane</span> Place in Lesser Poland Voivodeship, Poland

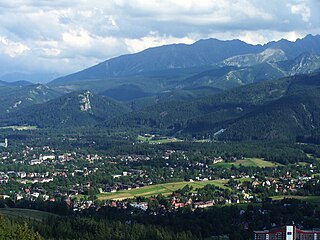
Zakopane is a town in the south of Poland, in the southern part of the Podhale region at the foot of the Tatra Mountains. From 1975 to 1998, it was part of Nowy Sącz Voivodeship; since 1999, it has been part of Lesser Poland Voivodeship. As of 2017 its population was 27,266. Zakopane is a centre of Goral culture and is often referred to as "the winter capital of Poland". It is a popular destination for mountaineering, skiing, and tourism.

<span class="mw-page-title-main">Koszalin</span> Place in West Pomeranian Voivodeship, Poland

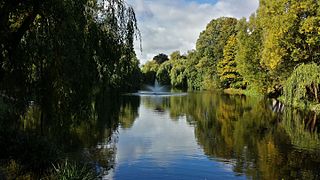
Koszalin is a city in northwestern Poland, in Western Pomerania. It is located 12 kilometres south of the Baltic Sea coast, and intersected by the river Dzierżęcinka. Koszalin is also a county-status city and capital of Koszalin County of West Pomeranian Voivodeship since 1999. Previously, it was a capital of Koszalin Voivodeship (1950–1998). Since 2010 mayor of Koszalin is Piotr Jedliński.

<span class="mw-page-title-main">Lębork</span> Place in Pomeranian Voivodeship, Poland

Lębork is a town of 37,000 people on the Łeba and Okalica rivers in the Gdańsk Pomerania region in northern Poland. It is the capital of Lębork County in Pomeranian Voivodeship.

<span class="mw-page-title-main">Ustka</span> Place in Pomeranian Voivodeship, Poland

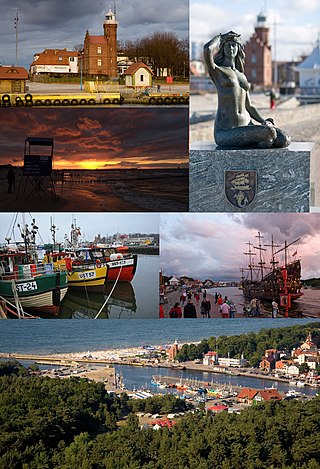
Ustka is a spa town in the Middle Pomerania region of northern Poland with 17,100 inhabitants (2001). It is part of Słupsk County in Pomeranian Voivodeship. It is located on the Slovincian Coast on the Baltic Sea. It is a port town and popular summer seaside resort of Poland.

<span class="mw-page-title-main">Kozienice</span> Place in Masovian Voivodeship, Poland

Kozienice is a town in eastern Poland with 21,500 inhabitants (1995). Located four miles from the Vistula, it is the capital of Kozienice County.

<span class="mw-page-title-main">Kętrzyn</span> Place in Warmian-Masurian Voivodeship, Poland

Kętrzyn is a town in northeastern Poland with 27,478 inhabitants (2019). It is the capital of Kętrzyn County in the Warmian-Masurian Voivodeship.

<span class="mw-page-title-main">Sandomierz</span> Town in Świętokrzyskie Voivodeship, Poland

Sandomierz is a historic town in south-eastern Poland with 23,863 inhabitants, situated on the Vistula River in the Sandomierz Basin. It has been part of Świętokrzyskie Voivodeship since 1999, having previously been located in the Tarnobrzeg Voivodeship. It is the capital of Sandomierz County. Sandomierz is known for its preserved Old Town, a major cultural and tourist attraction which was declared a National Monument of Poland in 2017.

<span class="mw-page-title-main">Terespol</span> Place in Lublin Voivodeship, Poland

Terespol is a town in eastern Poland on the border with Belarus. It lies on the border river Bug, directly opposite the city of Brest, Belarus, making it a border town. It has 5,794 inhabitants as of 2014.

<span class="mw-page-title-main">Mława</span> Place in Masovian Voivodeship, Poland

Mława is a town in north-east Poland with 30,403 inhabitants in 2020. It is the capital of Mława County. It is situated in the Masovian Voivodeship.

<span class="mw-page-title-main">Koło</span> Place in Greater Poland Voivodeship, Poland

Koło is a town on the Warta River in central Poland with 23,101 inhabitants (2006). It is situated in the Greater Poland Voivodship, having previously been in Konin Voivodship (1975–1998), and it is the capital of Koło County.

<span class="mw-page-title-main">Łeba</span> Place in Pomeranian Voivodeship, Poland

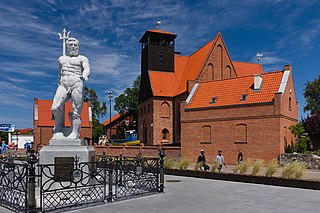
Łeba is a seaside town in the Pomeranian Voivodeship of northern Poland. It is located in the region of Gdańsk Pomerania (Pomerelia), near Łebsko Lake and the mouth of the river Łeba on the Slovincian Coast of the Baltic Sea.

<span class="mw-page-title-main">Hel, Poland</span> Place in Pomeranian Voivodeship, Poland

Hel is a seaside Resort city in Puck County, Pomeranian Voivodeship, in northern Poland, located on the tip of the Hel Peninsula, some 33 kilometres from the Polish mainland.

<span class="mw-page-title-main">Lesko</span> Place in Subcarpathian Voivodeship, Poland

Lesko is a town in south-eastern Poland with a population of 5,755 (02.06.2009). situated in the Bieszczady mountains. It is located in the heartland of the Doły (Pits), and its average altitude is 390 metres above sea level, although there are some hills located within the confines of the city. Since 2002 it has been the capital of Lesko County.

<span class="mw-page-title-main">Słubice</span> Place in Lubusz Voivodeship, Poland

Słubice is a border town in the Lubusz Voivodeship, in western Poland. Located on the Oder river, it lies directly opposite the city of Frankfurt (Oder) in Germany, which it was a part of as Dammvorstadt until 1945. As of 2019, the town had a population of 16,705, with an urban agglomeration of Słubice-Frankfurt counting 85,000 inhabitants. Previously located in the Gorzów Wielkopolski Voivodeship (1975–1998), the town is currently the capital of Słubice County and the administrative seat of the Gmina Słubice. It is part of the historical region of Lubusz Land.

<span class="mw-page-title-main">Sněžka</span> Mountain on Czech-Polish border

Sněžka or Śnieżka is a mountain on the border between the Czech Republic and Poland, the most prominent point of the Silesian Ridge in the Giant Mountains. At 1,603.3 metres (5,260 ft), its summit is the highest point in the Czech Republic, in Lower Silesian Voivodeship, in the Giant Mountains and in the entire Sudetes.

<span class="mw-page-title-main">Mikołajki</span> Place in Warmian-Masurian Voivodeship, Poland

Mikołajki is a resort town in Mrągowo County in the Warmian-Masurian Voivodeship in north-eastern Poland, with 3,852 inhabitants as of 2017. The town is located near the Śniardwy, the largest lake of both the Masurian Lake District and Poland. It is located in the center of the ethnocultural region of Masuria.

<span class="mw-page-title-main">Kasprowy Wierch</span>

Kasprowy Wierch is a peak of a long crest in the Western Tatras one of Poland's main winter ski areas. Its dominant southern crests mark the border with Slovakia. It is accessible in most conditions by foot and daily by cablecar.

<span class="mw-page-title-main">Sulejów</span> Place in Łódź Voivodeship, Poland

Sulejów is a town in central Poland with 6,130 inhabitants (2020). It is situated in Łódź Voivodeship, having previously been in Piotrków Voivodeship (1975–1998). Sulejów gives its name to the protected area known as Sulejów Landscape Park.

<span class="mw-page-title-main">Resko</span> Place in West Pomeranian Voivodeship, Poland

Resko is a town in Łobez County, West Pomeranian Voivodeship, Poland, with 4,436 inhabitants (2004). It is located on the Rega River.

Piła is a village in the administrative district of Gmina Gostycyn, within Tuchola County, Kuyavian-Pomeranian Voivodeship, in north-central Poland. It lies approximately 6 kilometres (4 mi) east of Gostycyn, 12 km (7 mi) south of Tuchola, and 44 km (27 mi) north of Bydgoszcz.

References

  1. "Period of Record Monthly Climate Summary". MAUNA LOA SLOPE OBS, HAWAII. NOAA. Retrieved 2012-06-05.
  2. "MAUNA LOA SLOPE OBS 39, HAWAII Period of Record General Climate Summary - Temperature". Western Regional Climate Center. Retrieved 20 May 2019.
  3. "NOWData – NOAA Online Weather Data". National Oceanic and Atmospheric Administration. Archived from the original on May 2, 2021. Retrieved 2021-05-18.
  4. "Station: MT WASHINGTON, NH". U.S. Climate Normals 2020: U.S. Monthly Climate Normals (1991-2020). National Oceanic and Atmospheric Administration. Archived from the original on May 12, 2021. Retrieved 2021-05-18.
  5. "WMO Climate Normals for MOUNT WASHINGTON, NH 1961–1990". National Oceanic and Atmospheric Administration. Archived from the original on May 25, 2017. Retrieved 2014-06-09.
  6. "Mount Washington Observatory: Normals, Means and Extreme". Mount Washington Observatory. Archived from the original on July 2, 2014. Retrieved 2010-08-07.
  7. "Today's Weather atop Mount Washington". Mount Washington Observatory. 2013-01-14. Archived from the original on 2013-01-15.
  8. 1 2 "Średnia minimalna temperatura powietrza". Normy klimatyczne 1991-2020 (in Polish). Institute of Meteorology and Water Management. Archived from the original on 15 January 2022. Retrieved 22 January 2022.
  9. 1 2 "Średnia maksymalna temperatura powietrza". Normy klimatyczne 1991-2020 (in Polish). Institute of Meteorology and Water Management. Archived from the original on 15 January 2022. Retrieved 22 January 2022.
  10. 1 2 "Miesięczna suma opadu". Normy klimatyczne 1991-2020 (in Polish). Institute of Meteorology and Water Management. Archived from the original on 9 January 2022. Retrieved 22 January 2022.
  11. "Climate StatisticsMonthly Mean". Central Weather Bureau. Retrieved March 1, 2015.
  12. "Climate: Modelled Mount Apo – Climate graph, Temperature graph, Climate table". meteoblue.com. Retrieved 15 Aug 2021.
  13. 帕里城市介绍. Weather China. 2011. Retrieved on December 3, 2011.
  14. "Climate: La Rinconada, Puno" . Retrieved 2 November 2014.
  15. "Normales climatológicas 1951-2010" (in Spanish). Servicio Meteorológico Nacional. Archived from the original on March 3, 2016. Retrieved January 16, 2013.
  16. "German climate normals 1981-2010" (in French). Retrieved 15 January 2019.
  17. "Weather extremes for Zugspitze". Météo Climat. Retrieved 15 January 2019.
  18. "Climate: Cerro de Pasco" . Retrieved 5 September 2013.
  19. 中国地面气候标准值月值 (in Simplified Chinese). China Meteorological Administration. Retrieved 2018-11-27.
  20. "Climate Normals Piz Corvatsch (Reference period 1991−2020)" (PDF). Swiss Federal Office of Meteorology and Climatology, MeteoSwiss. Retrieved 29 January 2022.
  21. "Seasonal Temperature and Precipitation Information". Western Regional Climate Center. Retrieved April 9, 2013.