See also
- Places in the United States with notable demographic characteristics
- Births of U.S. states and territories by race/ethnicity
- Demography of the United States
This article includes a city-related list of lists.
The following are links to lists of United States cities in which a majority of the population is not white organized by majority racial group. The US census officially recognizes six racial categories: White American, Black or African American, Native American and Alaska Native, Asian American, Native Hawaiian and Other Pacific Islander, and people of two or more races. It should not, however, be inferred that every city not on one of the lists below has a white majority. (There are many cities in the United States in which no racial group is in the majority.)

The population of Puerto Rico has been shaped by native American settlement, European colonization especially under the Spanish Empire, slavery and economic migration. Demographic features of the population of Puerto Rico include population density, ethnicity, education of the populace, health of the populace, economic status, religious affiliations and other aspects of the population.

The United States had an official estimated resident population of 334,914,895 on July 1, 2023, according to the U.S. Census Bureau. This figure includes the 50 states and the Washington, D.C. but excludes the population of five unincorporated U.S. territories as well as several minor island possessions. The United States is the third most populous country in the world, and the most populous in the Americas and the Western Hemisphere. The Census Bureau showed a population increase of 0.4% for the twelve-month period ending in July 2022, below the world average annual rate of 0.9%. The total fertility rate in the United States estimated for 2022 is 1.665 children per woman, which is below the replacement fertility rate of approximately 2.1. By several metrics, including racial and ethnic background, religious affiliation, and percentage of rural and urban divide, Illinois is the most representative of the larger demography of the United States.

Aleutians West Census Area is a census area located in the U.S. state of Alaska. As of the 2020 census, the population was 5,232, down from 5,561 in 2010.
The terms multiracial people or mixed-race people refer to people who are of more than one race, and the terms multi-ethnic people or ethnically mixed people refer to people who are of more than one ethnicity. A variety of terms have been used both historically and presently for mixed-race people in a variety of contexts, including multiethnic, polyethnic, occasionally bi-ethnic, Métis, Muwallad, Melezi, Coloured, Dougla, half-caste, ʻafakasi, mestizo, mutt, Melungeon, quadroon, octoroon, sambo/zambo, Eurasian, hapa, hāfu, Garifuna, pardo, and Gurans. A number of these once-acceptable terms are now considered offensive, in addition to those that were initially coined for pejorative use.

In the United States of America, majority-minority area or minority-majority area is a term describing a U.S. state or jurisdiction whose population is composed of less than 50% non-Hispanic whites. Racial data is derived from self-identification questions on the U.S. census and on U.S. Census Bureau estimates.. The term is often used in voting rights law to designate voting districts that are designed under the Voting Rights Act to enable ethnic or language minorities "the opportunity to elect their candidate of choice." In that context, the term was first used by the Supreme Court in 1977. The Court had previously used the term in employment discrimination and labor relations cases.

White Americans are Americans who identify as white people. This group constitutes the majority of the people in the United States. According to the 2020 census, 71%, or 235,411,507 people, were White alone or in combination, and 61.6%, or 204,277,273 people, were White alone. This represented a national white demographic decline from a 72.4% white alone share of the U.S. population in 2010.

The United States has a racially and ethnically diverse population. At the federal level, race and ethnicity have been categorized separately. The most recent United States census recognized five racial categories, as well as people who belong to two or more of the racial categories. The United States also recognizes the broader notion of ethnicity. The 2000 census and 2010 American Community Survey inquired about the "ancestry" of residents, while the 2020 census allowed people to enter their "origins". The Census Bureau also classified respondents as either Hispanic or Latino, identifying as an ethnicity, which comprises the minority group in the nation.

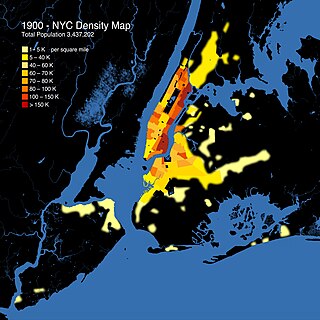
New York County, coterminous with the New York City borough of Manhattan, is the most densely populated U.S. county, with a density of 70,825.6/mi2 (27,267.4/km2) as of 2013. In 1910, it reached a peak of 101,548/mi2 (39,222.9/km2). The county is one of the original counties of New York State.

The demographics of Queens, the second-most populous borough in New York City, are highly diverse. No racial or ethnic group holds a majority in the borough.
The demographics of the Bronx are characterized by a Hispanic majority and by the lowest percentage of Whites among all boroughs.

Richmond County, also known as Staten Island is a borough of New York City, New York, United States. Staten Island is the least populated of the five boroughs with 475,000 people but is the third largest in area at 59 sq mi (153 km2).

The demographics of Minnesota are tracked by the United States Census Bureau, with additional data gathered by the Minnesota State Demographic Center. According to the most recent estimates, Minnesota's population as of 2020 was approximately 5.7 million, making it the 22nd most populous state in the United States. The total fertility rate in Minnesota was roughly 1.87 in 2019, slightly below the replacement rate of 2.1.
According to the U.S. Census Bureau, as of 2023, Texas was the second largest state in population after California, with a population of 30,503,301, an increase of more than 1.3 million people, or 4.7%, since the 29,145,505 of the 2020 census. Its apportioned population in 2020 was 29,183,290. Since the beginning of the 21st century, the state of Texas has experienced strong population growth. Texas has many major cities and metropolitan areas, along with many towns and rural areas. Much of the population is concentrated in the major cities of Dallas–Fort Worth, Austin, San Antonio, Houston, McAllen, and El Paso and their corresponding metropolitan areas. The first four aforementioned main urban centers are also referred to as the Texas Triangle megaregion.
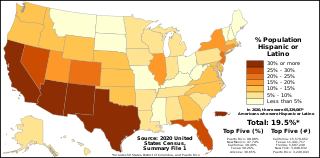
The demographics of Hispanic and Latino Americans depict a population that is the second-largest ethnic group in the United States, 62 million people or 18.7% of the national population.
The racial and ethnic history of New York City has varied widely; from its sale to the Dutch by Native American residents, to the modern multi-cultural period.

The demographics of Cleveland have fluctuated throughout the city's history. From its founding in 1796, Cleveland's population grew to 261,353 by 1890, and to 796,841 by 1920, making it the fifth largest city in the United States at the time. By 1930, the population rose to 900,429 and, after World War II, it reached 914,808. Due to various historical factors including deindustrialization, suburbanization, and urban sprawl, Cleveland's population began decreasing in the 1960s. By 1970, the city's population was 750,903. By 1980, it was 573,822 and it had lost its position as one of the top 10 largest cities in the U.S. By 2020, the population had further fallen to 372,624. Beginning in 2018, the city's population began to flatten, after decades of decline. Additionally, between 2010 and 2020, several neighborhoods within Cleveland saw a significant population increase, most notably Downtown, but also University Circle and several West Side neighborhoods.
The following is a list of California locations by race.

The 2020 United States Census reported that San Francisco had a population of 873,965—an increase from the 2010 Census count of 805,235. The 2022 Census Bureau American Community Survey put the population at 808,437: a decrease of 65,528 from 2020. With a population density of 18,633 per square mile (7,194/km2), San Francisco is the second-most densely populated major American city, behind only New York.