
Timeline of computing presents events in the history of computing organized by year and grouped into six topic areas: predictions and concepts, first use and inventions, hardware systems and processors, operating systems, programming languages, and new application areas.

A timeline is a display of a list of events in chronological order. It is typically a graphic design showing a long bar labelled with dates paralleling it, and usually contemporaneous events.

Family Feud is an American television game show created by Mark Goodson. Two families compete on each episode to name the most popular answers to survey questions in order to win cash and prizes.

A logarithmic scale is a method used to display numerical data that spans a broad range of values, especially when there are significant differences between the magnitudes of the numbers involved.

A chart is a graphical representation for data visualization, in which "the data is represented by symbols, such as bars in a bar chart, lines in a line chart, or slices in a pie chart". A chart can represent tabular numeric data, functions or some kinds of quality structure and provides different info.

Graph paper, coordinate paper, grid paper, or squared paper is writing paper that is printed with fine lines making up a regular grid. It is available either as loose leaf paper or bound in notebooks.

A bar chart or bar graph is a chart or graph that presents categorical data with rectangular bars with heights or lengths proportional to the values that they represent. The bars can be plotted vertically or horizontally. A vertical bar chart is sometimes called a column chart.

A scatter plot, also called a scatterplot, scatter graph, scatter chart, scattergram, or scatter diagram, is a type of plot or mathematical diagram using Cartesian coordinates to display values for typically two variables for a set of data. If the points are coded (color/shape/size), one additional variable can be displayed. The data are displayed as a collection of points, each having the value of one variable determining the position on the horizontal axis and the value of the other variable determining the position on the vertical axis.
In biology and genetic genealogy, the most recent common ancestor (MRCA), also known as the last common ancestor (LCA), of a set of organisms is the most recent individual from which all the organisms of the set are descended. The term is also used in reference to the ancestry of groups of genes (haplotypes) rather than organisms.
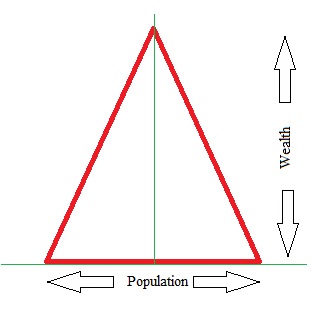
The bottom of the pyramid, bottom of the wealth pyramid, bottom of the income pyramid or the base of the pyramid is the largest, but poorest socio-economic group. In global terms, this is the 2.7 billion people who live on less than $2.50 a day.

Jason Dean Bennison, better known by his stage name J.D. Fortune, is a Canadian singer and songwriter. He was the frontman of the Australian rock band INXS for six years after winning the first season of the CBS reality television series Rock Star: INXS; in 2005, replacing its late lead singer Michael Hutchence. After the show, Fortune fronted INXS through an extended 2+1⁄2-year world tour supporting the release of the album Switch, INXS's first studio album with Fortune, and the only album with new INXS material after Hutchence's death.

In science and engineering, a semi-log plot/graph or semi-logarithmicplot/graph has one axis on a logarithmic scale, the other on a linear scale. It is useful for data with exponential relationships, where one variable covers a large range of values.

A spacetime diagram is a graphical illustration of locations in space at various times, especially in the special theory of relativity. Spacetime diagrams can show the geometry underlying phenomena like time dilation and length contraction without mathematical equations.
The Facebook Platform is the set of services, tools, and products provided by the social networking service Facebook for third-party developers to create their own applications and services that access data in Facebook.

Facebook F8 is a mostly-annual conference held by Meta Platforms since 2007, intended for developers and entrepreneurs who build products and services around the website. The event has generally started with a keynote speech by Facebook founder Mark Zuckerberg, followed by various breakout sessions concentrating on specific topics. Facebook has often introduced new features and made new announcements at the conference.
The survival function is a function that gives the probability that a patient, device, or other object of interest will survive past a certain time. The survival function is also known as the survivor function or reliability function. The term reliability function is common in engineering while the term survival function is used in a broader range of applications, including human mortality. The survival function is the complementary cumulative distribution function of the lifetime. Sometimes complementary cumulative distribution functions are called survival functions in general.

In statistics, a misleading graph, also known as a distorted graph, is a graph that misrepresents data, constituting a misuse of statistics and with the result that an incorrect conclusion may be derived from it.
This is a general overview and status of places affected by severe acute respiratory syndrome coronavirus 2 (SARS-CoV-2), the virus which causes coronavirus disease 2019 (COVID-19) and is responsible for the COVID-19 pandemic. The first human cases of COVID-19 were identified in Wuhan, the capital of the province of Hubei in China in December 2019. It spread to other areas of Asia, and then worldwide in early 2020.

This article contains the monthly cumulative number of deaths from the pandemic of coronavirus disease 2019 (COVID-19) reported by each country, territory, and subnational area to the World Health Organization (WHO) and published in WHO reports, tables, and spreadsheets. There are also maps and timeline graphs of daily and weekly deaths worldwide.