
Map regression is the process of working backwards from later maps to earlier maps of the same area, to determine change or to locate past features.
Map regression is the process of working backwards from later maps to earlier maps of the same area, to determine change or to locate past features.
The process is mainly used in research on the history of places, sometimes termed historic map regression. Comparing maps of an area compiled in different periods can help reconstruct the chronology of events which have altered the natural or built environment. In archaeology, map regression can help to locate features appearing only on earlier maps and to assign building phases. [1] It is often part of desk based assessments before field work is undertaken.
Map regression is performed either by comparing individual features between maps, or by re-projecting an entire map so as to fit another onto which it can then be superimposed. The process can include resolving any differences in map scale, projection, datum, or format; and the interpretation of each map in its meaning and accuracy.

A geodetic datum or geodetic system is a coordinate system, and a set of reference points, used to locate places on the Earth. An approximate definition of sea level is the datum WGS 84, an ellipsoid, whereas a more accurate definition is Earth Gravitational Model 2008 (EGM2008), using at least 2,159 spherical harmonics. Other datums are defined for other areas or at other times; ED50 was defined in 1950 over Europe and differs from WGS 84 by a few hundred meters depending on where in Europe you look. Mars has no oceans and so no sea level, but at least two martian datums have been used to locate places there.
Similarities between maps, such as topography or built structures, are identified to determine where distinct features from one map are plotted on another. One manual technique is to copy features from earlier maps onto transparent overlays placed on the most recent map which provides the spatial framework. By working in sequence back in time a chronology is compiled. This intensive process can promote a more considered assessment as every feature is treated individually. [2]
Computer based geographical information systems facilitate the scaling, rotation, and translation of an entire map to fit over another. [3] Georeferencing establishes a congruent relationship between maps, and allows each map to be transformed and automatically re-projected as an overlay. This method is useful for the regression of maps that differ in format, for example, raster images of early maps and vector representations of modern maps.
Georeferencing means that the internal coordinate system of a map or aerial photo image can be related to a ground system of geographic coordinates. The relevant coordinate transforms are typically stored within the image file, though there are many possible mechanisms for implementing georeferencing. The most visible effect of georeferencing is that display software can show ground coordinates and also measure ground distances and areas. In other words, Georeferencing means to associate something with locations in physical space. The term is commonly used in the geographic information systems field to describe the process of associating a physical map or raster image of a map with spatial locations. Georeferencing may be applied to any kind of object or structure that can be related to a geographical location, such as points of interest, roads, places, bridges, or buildings.

In computer graphics, a raster graphics or bitmap image is a dot matrix data structure that represents a generally rectangular grid of pixels, viewable via a monitor, paper, or other display medium. Raster images are stored in image files with varying formats.
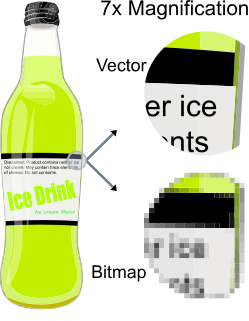
Vector graphics are computer graphics images that are defined in terms of 2D points, which are connected by lines and curves to form polygons and other shapes. Each of these points has a definite position on the x- and y-axis of the work plane and determines the direction of the path; further, each path may have various properties including values for stroke color, shape, curve, thickness, and fill. Vector graphics are commonly found today in the SVG, EPS and PDF graphic file formats and are intrinsically different from the more common raster graphics file formats of JPEG, PNG, APNG, GIF, and MPEG4.
Features not appearing on one map but shown on another do not necessarily indicate an actual difference, due to purpose, detail, or accuracy; for example, comparing cadastral and topographic maps.
Map format can reduce confidence in a regression. 'Strip' maps, or traverse surveys, which record features in a linear path can complicate the spatial interpolation required to match a planar format.
Historical research can involve early maps of uncertain accuracy or datum. They are often small scale which leads to the magnification of any position errors in enlarging to match large scale maps. Georeferencing is not always straightforward; topography such as river courses and coastlines change over time, as do road routes and other built structures.
A geographic information system (GIS) is a system designed to capture, store, manipulate, analyze, manage, and present spatial or geographic data. GIS applications are tools that allow users to create interactive queries, analyze spatial information, edit data in maps, and present the results of all these operations. GIS sometimes refers to geographic information science (GIScience), the science underlying geographic concepts, applications, and systems.

A map is a symbolic depiction emphasizing relationships between elements of some space, such as objects, regions, or themes.

In modern mapping, a topographic map is a type of map characterized by large-scale detail and quantitative representation of relief, usually using contour lines, but historically using a variety of methods. Traditional definitions require a topographic map to show both natural and man-made features. A topographic survey is typically published as a map series, made up of two or more map sheets that combine to form the whole map. A contour line is a line connecting places of equal elevation.
Topography is the study of the shape and features of land surfaces. The topography of an area could refer to the surface shapes and features themselves, or a description.
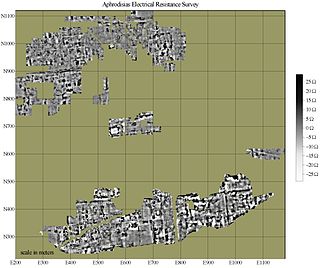
In archaeology, geophysical survey is ground-based physical sensing techniques used for archaeological imaging or mapping. Remote sensing and marine surveys are also used in archaeology, but are generally considered separate disciplines. Other terms, such as "geophysical prospection" and "archaeological geophysics" are generally synonymous.
In geodesy, conversion among different geographic coordinate systems is made necessary by the different geographic coordinate systems in use across the world and over time. Coordinate conversion is composed of a number of different types of conversion: format change of geographic coordinates, conversion of coordinate systems, or transformation to different geodetic datums. Geographic coordinate conversion has applications in cartography, surveying, navigation and geographic information systems.
A GIS file format is a standard of encoding geographical information into a computer file. They are created mainly by government mapping agencies or by GIS software developers.

In archaeology, survey or field survey is a type of field research by which archaeologists search for archaeological sites and collect information about the location, distribution and organization of past human cultures across a large area. Archaeologists conduct surveys to search for particular archaeological sites or kinds of sites, to detect patterns in the distribution of material culture over regions, to make generalizations or test hypotheses about past cultures, and to assess the risks that development projects will have adverse impacts on archaeological heritage. The surveys may be: (a) intrusive or non-intrusive, depending on the needs of the survey team and; (b) extensive or intensive, depending on the types of research questions being asked of the landscape in question. Surveys can be a practical way to decide whether or not to carry out an excavation, but may also be ends in themselves, as they produce important information about past human activities in a regional context.
A spatial reference system (SRS) or coordinate reference system (CRS) is a coordinate-based local, regional or global system used to locate geographical entities. A spatial reference system defines a specific map projection, as well as transformations between different spatial reference systems. Spatial reference systems are defined by the OGC's Simple feature access using well-known text representation of coordinate reference systems, and support has been implemented by several standards-based geographic information systems. Spatial reference systems can be referred to using a SRID integer, including EPSG codes defined by the International Association of Oil and Gas Producers. It is specified in ISO 19111:2007 Geographic information—Spatial referencing by coordinates, prepared by ISO/TC 211, also published as OGC Abstract Specification, Topic 2: Spatial referencing by coordinate.

Spatial analysis or spatial statistics includes any of the formal techniques which study entities using their topological, geometric, or geographic properties. Spatial analysis includes a variety of techniques, many still in their early development, using different analytic approaches and applied in fields as diverse as astronomy, with its studies of the placement of galaxies in the cosmos, to chip fabrication engineering, with its use of "place and route" algorithms to build complex wiring structures. In a more restricted sense, spatial analysis is the technique applied to structures at the human scale, most notably in the analysis of geographic data.
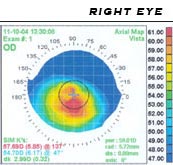
Corneal topography, also known as photokeratoscopy or videokeratography, is a non-invasive medical imaging technique for mapping the surface curvature of the cornea, the outer structure of the eye. Since the cornea is normally responsible for some 70% of the eye's refractive power, its topography is of critical importance in determining the quality of vision and corneal health.

The Geospatial Data Abstraction Library (GDAL) is a computer software library for reading and writing raster and vector geospatial data formats, and is released under the permissive X/MIT style free software license by the Open Source Geospatial Foundation. As a library, it presents a single abstract data model to the calling application for all supported formats. It may also be built with a variety of useful command line interface utilities for data translation and processing. Projections and transformations are supported by the PROJ.4 library.
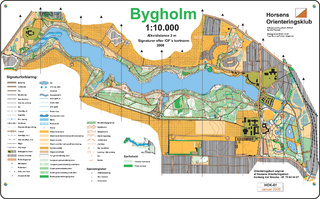
An orienteering map is a map specially prepared for use in orienteering competitions. It is a topographic map with extra details to help the competitor navigate through the competition area.
Reverse geocoding is the process of back (reverse) coding of a point location to a readable address or place name. This permits the identification of nearby street addresses, places, and/or areal subdivisions such as neighbourhoods, county, state, or country. Combined with geocoding and routing services, reverse geocoding is a critical component of mobile location-based services and Enhanced 911 to convert a coordinate obtained by GPS to a readable street address which is easier to understand by the end user.

John Rocque's Map of London, 1746, more formally "A plan of the cities of London and Westminster, and borough of Southwark", surveyed by John Rocque and engraved by John Pine, is a map of Georgian London to a scale of 26 inches to a mile. The map consists of twenty-four sheets and is 3.84 by 2.01 metres in overall size. Taking nearly ten years to survey, engrave and publish, it has been described as "a magnificent example of cartography ... one of the greatest and most handsome plans of any city".
Vector tiles, tiled vectors or vectiles are packets of geographic data, packaged into pre-defined roughly-square shaped "tiles" for transfer over the web. This is an emerging method for delivering styled web maps, combining certain benefits of pre-rendered raster map tiles with vector map data. As with the widely used raster tiled web maps, map data is requested by a client as a set of "tiles" corresponding to square areas of land of a pre-defined size and location. Unlike raster tiled web maps, however, the server returns vector map data, which has been clipped to the boundaries of each tile, instead of a pre-rendered map image.
EMIGMA is a geophysics interpretation software platform developed by Petros Eikon Incorporated for data processing, simulation, inversion and imaging as well as other associated tasks. The software focuses on non-seismic applications and operates only on the Windows operating system. It supports files standard to the industry, instrument native formats as well as files used by other software in the industry such as AutoCAD, Google Earth and Oasis montaj. There is a free version of EMIGMA called EMIGMA Basic developed to allow viewing of databases created by licensed users. It does not allow data simulation nor modeling nor data import. The software is utilized by geoscientists for exploration and delineating purposes in mining, oil and gas and groundwater as well as hydrologists, environmental engineers, archaeologists and academic institutions for research purposes. Principal contributors to the software are R. W. Groom, H. Wu, E. Vassilenko, R. Jia, C. Ottay and C. Alvarez.
Video Multimethod Assessment Fusion (VMAF) is an objective full-reference video quality metric developed by Netflix in cooperation with the University of Southern California and the Laboratory for Image and Video Engineering (LIVE) at The University of Texas at Austin. It predicts subjective video quality based on a reference and distorted video sequence. The metric can be used to evaluate the quality of different video codecs, encoders, encoding settings, or transmission variants.
3D Structure Change Detection is a type of Change detection (GIS) processes for GIS. It is a process that measures how the volume of a particular area have changed between two or more time periods. A high-spatial resolution Digital elevation model (DEM) that provides accurate 4-d structural information over area of interest is required to compute such changes. In production, two or more DEMs that cover the same area are used to monitor topographic changes of area. By comparing the DEMs made at different times, structure of terrain changes can be realized by the ground elevation difference from DEMs. Details, occurring time and accuracy of such changes are strongly relied on the resolution, quality of DEMs. In general, the problem of involves whether or not a change has occurred, or whether several changes have occurred. Such structure changes detection has been widely used to assess urban growth, impact of natural disasters like earthquake, volcano and battle damage assessment.