Middle class in Colombia

Last updated

The Colombian middle class is a social class in Colombia, it is a broadly used term. There are many definitions. Middle class also has subcategories, such as upper middle class and lower middle and it can contain a very large number of individuals with vastly different professions and ways of living. Middle class and the overall standards of living are affected by the economy of a country, one which has a growing economy and positive economic indicators, will be more likely to have a larger middle class with decent standards of living and less inequality. [1] Colombia is a country that has been experiencing a significantly fast economic growth, [2] which has impacted the income, wealth and expenditure of its population, and the proportion of its population belonging to middle class.

Contents

In 1993, the population in the lower class in Latin America (earning less than US$4 a day) was 2.5 times the population in the middle class (earning US$4 to US$50). Ten years later, this two subgroups had approximately the same number of individuals [3]

Definition

Social classes are a way of categorising individuals according to different factors, mainly based in income and wealth. There are many ways in which middle class can be defined. A global middle class can be defined as the one that has a purchasing power parity per capita of US$10 to US$50 per day per household. [4] Additionally, middle class emphasises on the values of hard work and education, two elements which are necessary to achieve a sustainable economic growth. It is expected a growth for the middle class by 5.3% in number of individuals and by 4.6% in purchasing power (real) between 2010 and 2020.

In Colombia the numbers are different. A household can be considered middle class if it earns between US$300 and US$850 per month, which is US$10 and US$29 per day. Any household earning anything more that this is considered high class and will be located on the top 10% of the richest in Colombia. [5]

Another important aspect when defining middle class is economic security. Economic security is a low probability of falling in poverty. The concept of economic security is vital in the definition of middle class as it implies having economic stability and the capacity to overcome unfortunate economic situations. A probability of falling back to poverty of 10% in 5 years is the maximum economic insecurity level that a middle class household could reasonably tolerate. A level higher than this would place the household in the lower class. [3]

Colombian government approach

The government of Colombia bases its social stratification on the housing of the population, not on other factors such as income or overall wealth. This system has scores from 0 to 6, being 0 the lowest and 6 the highest.  It bases the results on the physical conditions of the residence. Middle class individuals are those who live in a dwelling in the range of 3–4. [6] This system is used to manage public investment, identify which areas have higher needs, as well as to estimate tax costs.

Citizens on the higher social stratum pay more for utilities and taxes, this helps the lower stratum individuals pay less on utilities and taxes, it is a way of subsidising their costs. [6]

Sub divisions

Middle class is still a broad group that can contain many individuals, with differences in their income. This creates subcategories, upper middle class and lower middle class are the main ones.

Upper middle class

Universidad de Los Andes Universidad de los Andes (3326108271).jpg
Universidad de Los Andes

Upper middle class has access to more education. Generally, the higher the social class, the more education the individuals receive. This affects the social class mobility as more education means an increase in economic security. Upper middle class has access to better educational institutions, such as the Andes University and the Colombian National University. Upper-middle-class families also have higher access to credit and to property markets. [7] It is also characterised for having a higher economic security and lower chances of falling into poverty. In Colombia, upper middle class does not receive economic help from the government.

National University of Colombia Universidad nacional de colombia.JPG
National University of Colombia

Lower middle class

This group has an income between US$4 and US$10. This group has lower economic security and higher chances to fall back into poverty. Lower middle class does not have the same educational opportunities as the upper middle class, as they don't have the resources to pay for the tuition costs from prestigious universities. Due to this, and to minimise the inequality and maximise the access to education, the government has had several initiatives where the education for the lower classes is subsidised, so the best students from the lower classes do not have to pay for their education. [8]

A common occurrence in lower-middle-class families is that the money received from their employment is enough to cover all basic necessities but there is not much money remaining for unnecessary wants or luxury goods. Lower-middle-class families have financial limitations. This subsection relies on their employment to survive, there is low margin for savings and losing their employment would cause them to make changes in their lifestyle and would increase the probability of falling back to poverty. [9]

Lower middle class also has a higher proportion in manufacturing jobs, and receives some help from the government to cover certain expenses.

Occupations

Bancolombia office building Edificio Bancolombia - luces.jpg
Bancolombia office building

Middle class has varied occupations. Most likely middle class individuals are formal employees, rather than self employed, unemployed or employer. lower class individuals rely more on self employment or suffer from unemployment, and high class individuals are mostly employers or self employed.

In terms of economic sectors, middle class employees commonly work in the services industry, among those are health, education and public services. Manufacturing employment is also more common in middle class than in any other class.

Middle class employees are frequently formally educated, employed by a private company with a formal contract, which gives the individual rights to social benefits. [3]

Some employees from the lower middle class are not formal employees, these subset is the one with the lowest reported earnings from the whole set of middle class employees. [5]

Middle class in the region

There are many similarities as well as many differences in the matter of middle class in Latin America and the Caribbean. The first common factor in the region is education, the head of a middle-class family had significantly more education years than the head of a lower-class family. Additionally, throughout the region, middle-class families tend to live in urban areas, at a higher rate than lower classes. Most of the countries had similarities in the employment sector, most middle class workers are not in the public sector (except Mexico and Peru). There is only one country in which the public sector employs more than a quarter of the population, Honduras. [3]

In the region, middle class individuals have many similarities. A middle class person from any country will have more similarities with a middle class person from another country from the region, rather than with a lower class person from its same country. But when values and aspirations are included, this middle class person will have more in common with a lower class person from its own country than with a middle class person from another country. [3]

Changes in middle class

Mobility

Social mobility refers to the ability for individuals to move between social classes. Mobility in Latin American and Colombia has been increasing in the previous years. 43% of the whole population changed social classes between the beginning of 1990 and the end of the 2000s. Most of this movement was upwards, it was a change from a lower to a higher social class, only 2% of the population suffered a downwards movement. [3] One factor that significantly affected mobility was the years of schooling of the head of the family, there was a strong positive relation between the years of schooling and the mobility. Other factors that affect mobility are GDP growth, government spending in health and education services and transfer payments.

Changes in income signify an increase in mobility.

Mobility is also related to politics and standards of living, if an individual lived in a society with a higher mobility, the oppression and injustice would be less tolerable, not more.

There is low mobility in terms of income, despite the increase in mobility, the result generated by this change is still very low compared to world standards. This low mobility is accompanied by a high inequality in the region. There is an identified relation between these two factors, the higher the income inequality in a region, the lower the mobility is going to be.

Other factors like parents' income, education and background still affect mobility. More specifically, intergenerational mobility, which is the ability to move social classes related to the conditions of the parents. [3]

Current middle class

Stratum 4 residential building Estrato 4.jpg
Stratum 4 residential building

According to a report from the world bank, middle class has grown by 50% in Latin America, from the years 2003 to 2009. [10]

Living

From a family point of view, middle class has some similar characteristics, between 1992 and 2009, the average size of a middle-class family decreased from 3.3 to 2.9 individuals. Another factor that middle-class families have in common is the employment of the mother, 73% of women in middle-class families are employed or actively seeking employment, compared to 62% of the total population. [3] The decrease in the number of children per household is also an important factor which is increasing the population in the middle class, women can also access the labour market and having no children increases the investment and purchasing capacity. [11]

Debt is also a common factor in the middle class, many of the purchases including property, vehicles, travel and study are often financed through debt. [9]

Economic factors

Economic indicators

Colombia's market had a steady growth, except for 1999, where the country suffered a recession, from there, it has had an impressive market growth, around 6.9%, one of the highest growth rates in Latin America. [12] Unemployment rate was 9.4% in 2017, [13] external debt equals to 39.9% of GDP, [14] and annual inflation in 2017 closed at 4.09% YoY. [13]

Inequality

Latin America is the world's most unequal region, the income per capita of the richest 10% is 24 times that of the poorest 30%, This inequality can be explained by diverse reasons, the first one being education, the richest minority in Colombia has more access to education than the lower classes, in average the top 10% receives 13 years of education while the bottom 30% only receives 5 years. [15]

Gini Index

Gini Index is a measure of inequality in a country, A coefficient of 0 indicates a perfect equality, meaning that all the wealth is perfectly spread among the population, and a coefficient of 1 means that the wealth is concentrated only in one individual. [16] Colombia has a Gini index of 49.7 (2017), even though it has been on a decreasing trend, it is still one of the highest in the world [12th Position globally,] [16] The decreasing trend on the Gini coefficient means that the distribution of income is becoming more even, and it is in accordance to the increase in middle class in Colombia.

Related Research Articles

<span class="mw-page-title-main">Gini coefficient</span> Measure of inequality of a distribution

In economics, the Gini coefficient, also known as the Gini index or Gini ratio, is a measure of statistical dispersion intended to represent the income inequality, the wealth inequality, or the consumption inequality within a nation or a social group. It was developed by Italian statistician and sociologist Corrado Gini.

<span class="mw-page-title-main">Economic inequality</span> Distribution of income or wealth between different groups

Economic inequality is an umbrella term for a) income inequality or distribution of income, b) wealth inequality or distribution of wealth, and c) consumption inequality. Each of these can be measured between two or more nations, within a single nation, or between and within sub-populations.

<span class="mw-page-title-main">Social mobility</span> Mobility to move social classes

Social mobility is the movement of individuals, families, households or other categories of people within or between social strata in a society. It is a change in social status relative to one's current social location within a given society. This movement occurs between layers or tiers in an open system of social stratification. Open stratification systems are those in which at least some value is given to achieved status characteristics in a society. The movement can be in a downward or upward direction. Markers for social mobility such as education and class, are used to predict, discuss and learn more about an individual or a group's mobility in society.

<span class="mw-page-title-main">Income distribution</span> How a countrys total GDP is distributed amongst its population

In economics, income distribution covers how a country's total GDP is distributed amongst its population. Economic theory and economic policy have long seen income and its distribution as a central concern. Unequal distribution of income causes economic inequality which is a concern in almost all countries around the world.

Income inequality metrics or income distribution metrics are used by social scientists to measure the distribution of income and economic inequality among the participants in a particular economy, such as that of a specific country or of the world in general. While different theories may try to explain how income inequality comes about, income inequality metrics simply provide a system of measurement used to determine the dispersion of incomes. The concept of inequality is distinct from poverty and fairness.

<span class="mw-page-title-main">Economic mobility</span> Ability to improve ones economic status

Economic mobility is the ability of an individual, family or some other group to improve their economic status—usually measured in income. Economic mobility is often measured by movement between income quintiles. Economic mobility may be considered a type of social mobility, which is often measured in change in income.

In economics, personal income refers to the total earnings of an individual from various sources such as wages, investment ventures, and other sources of income. It encompasses all the products and money received by an individual.
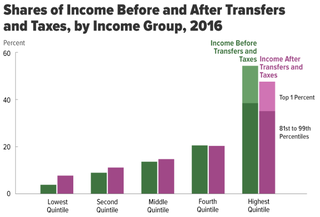
<span class="mw-page-title-main">Income inequality in the United States</span>

Income inequality has fluctuated considerably in the United States since measurements began around 1915, moving in an arc between peaks in the 1920s and 2000s, with a 30-year period of relatively lower inequality between 1950 and 1980.

Income in India discusses the financial state in India. With rising economic growth and prosperity, India's income is also rising rapidly. As an overview, India's per capita net national income or NNI was around Rs. 98,374 in 2022-23. The per-capita income is a crude indicator of the prosperity of a country. In contrast, the gross national income at constant prices stood at over 128 trillion rupees. According to a 2021 report by the Pew Research Center, India has roughly 1.2 billion lower-income individuals, 66 million middle-income individuals, 16 million upper-middle-income individuals, and barely 2 million in the high-income group. According to The Economist, 78 million of India's population are considered middle class as of 2017, if defined using the cutoff of those making more than $10 per day, a standard used by the India's National Council of Applied Economic Research. According to the World Bank, 93% of India's population lived on less than $10 per day, and 99% lived on less than $20 per day in 2021.

<span class="mw-page-title-main">Social inequality</span> Uneven distribution of resources in a society

Social inequality occurs when resources within a society are distributed unevenly, often as a result of inequitable allocation practices that create distinct unequal patterns based on socially defined categories of people. Differences in accessing social goods within society are influenced by factors like power, religion, kinship, prestige, race, ethnicity, gender, age, sexual orientation, intelligence and class. Social inequality usually implies the lack of equality of outcome, but may alternatively be conceptualized as a lack of equality in access to opportunity.

Income inequality in the Philippines is the extent to which income, most commonly measured by household or individual, is distributed in an uneven manner in the Philippines.

China's current mainly market economy features a high degree of income inequality. According to the Asian Development Bank Institute, “before China implemented reform and opening-up policies in 1978, its income distribution pattern was characterized as egalitarian in all aspects.”

Brazil has high income inequality despite high rates of economic growth. The country's richest 1% of the population have 13% of all household income, a similar economic result to that of the poorest 50%. This inequality results in poverty levels that are inconsistent with an economy the size of that of Brazil. The country's GDP growth in 2010 was 7.5%. In recent decades, there has been a modest decline in inequality for the country as a whole. Brazil's GINI coefficient, a measure of income inequality, has slowly decreased from 0.596 in 2001 to 0.543 in 2009. However, the numbers still point to a rather significant problem of income disparity.
<span class="mw-page-title-main">Income inequality in India</span>

Income inequality in India refers to the unequal distribution of wealth and income among its citizens. According to the CIA World Factbook, the Gini coefficient of India, which is a measure of income distribution inequality, was 35.2 in 2011, ranking 95th out of 157. Wealth distribution is also uneven, with one report estimating that 54% of the country's wealth is controlled by millionaires, the second highest after Russia, as of November 2016. The richest 1% of Indians own 58% of wealth, while the richest 10% of Indians own 80% of the wealth. This trend has consistently increased, meaning the rich are getting richer much faster than the poor, widening the income gap. Inequality worsened since the establishment of income tax in 1922, overtaking the British Raj's record of the share of the top 1% in national income, which was 20.7% in 1939–40.

<span class="mw-page-title-main">Socioeconomic mobility in the United States</span> Social and economic class mobility

Socioeconomic mobility in the United States refers to the upward or downward movement of Americans from one social class or economic level to another, through job changes, inheritance, marriage, connections, tax changes, innovation, illegal activities, hard work, lobbying, luck, health changes or other factors.

<span class="mw-page-title-main">Great Gatsby Curve</span> Relates income inequality and income mobility

The "Great Gatsby Curve" is the term given to the positive empirical relationship between cross-sectional income inequality and persistence of income across generations. The scatter plot shows a correlation between income inequality in a country and intergenerational income mobility.

<span class="mw-page-title-main">Effects of economic inequality</span>

Effects of income inequality, researchers have found, include higher rates of health and social problems, and lower rates of social goods, a lower population-wide satisfaction and happiness and even a lower level of economic growth when human capital is neglected for high-end consumption. For the top 21 industrialised countries, counting each person equally, life expectancy is lower in more unequal countries. A similar relationship exists among US states.

Education inequality in China exists on multiple levels, with significant disparities occurring along gender, geographical, and ethnic divides. More specifically, disparities exist in the distribution of educational resources nationwide, as well as the availability of education on levels, ranging from basic to higher education.

The spoon class theory refers to the idea that individuals in a country can be classified into different socioeconomic classes based on the assets and income level of their parents, and as a consequence, one's success in life depends entirely on being born into a wealthy family. The term appeared in 2015 and was first widely used among online communities in South Korea.

According to data from 2010, low-income earners make up 37.8% of South Korea's labour force. Conversely, the highest income earners make up 1.4% of the labour force.

References

  1. Kenton, Will. "Standard of Living". Investopedia. Retrieved 2019-05-31.
  2. "Report for Selected Countries and Subjects". www.imf.org. Retrieved 2019-05-31.
  3. 1 2 3 4 5 6 7 8 Francisco H. G., Ferreira. (10 April 2013). La movilidad economica y el crecimiento de la clase media en America Latina. The World Bank. ISBN   978-0821398760. OCLC   1096798864.
  4. Kharas, Homi (2010-01-26). "The Emerging Middle Class in Developing Countries". OECD Development Centre Working Papers. doi: 10.1787/5kmmp8lncrns-en .{{cite journal}}: Cite journal requires |journal= (help)
  5. 1 2 "¿Qué es la clase media en Colombia?". Revista Pesquisa Javeriana (in European Spanish). 2019-03-15. Retrieved 2019-05-31.
  6. 1 2 "Estratificación socioeconómica". www.dane.gov.co. Retrieved 2019-05-31.
  7. "¿Cuál es la realidad de la clase media colombiana?". www.elpais.com.co. Retrieved 2019-05-31.
  8. "Colombia's "Ser Pilo Paga" program: A smart investment?". World Bank Blogs. Retrieved 2019-05-31.
  9. 1 2 "Características que indican que usted es parte de la clase media". Periódico elDinero (in Spanish). 2018-03-02. Retrieved 2019-05-31.
  10. "GINI index (World Bank estimate) | Data". data.worldbank.org. Retrieved 2019-05-16.
  11. Tiempo, Casa Editorial El. "En Colombia, la clase media llegaría al 64% en la próxima década". Portafolio.co (in Spanish). Retrieved 2019-05-31.
  12. "Empleo en Colombia" (PDF).
  13. 1 2 "Índice de precios al consumidor (IPC)". Banco de la República (banco central de Colombia) (in Spanish). 2011-11-02. Retrieved 2019-05-31.
  14. "Deuda Externa" (PDF). Banco de la Republica.
  15. Dinero. "¿Por qué tanta desigualdad?". ¿Por qué tanta desigualdad? (in Spanish). Retrieved 2019-05-31.
  16. 1 2 "The World Factbook — Central Intelligence Agency". www.cia.gov. Archived from the original on June 11, 2009. Retrieved 2019-05-16.