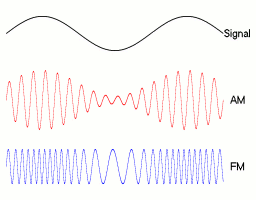
Frequency modulation (FM) is the encoding of information in a carrier wave by varying the instantaneous frequency of the wave. The technology is used in telecommunications, radio broadcasting, signal processing, and computing.
Frequency modulation synthesis is a form of sound synthesis whereby the frequency of a waveform is changed by modulating its frequency with a modulator. The frequency of an oscillator is altered "in accordance with the amplitude of a modulating signal".
Phase modulation (PM) is a modulation pattern for conditioning communication signals for transmission. It encodes a message signal as variations in the instantaneous phase of a carrier wave. Phase modulation is one of the two principal forms of angle modulation, together with frequency modulation.
In engineering, a transfer function of a system, sub-system, or component is a mathematical function that theoretically models the system's output for each possible input. They are widely used in electronics and control systems. In some simple cases, this function is a two-dimensional graph of an independent scalar input versus the dependent scalar output, called a transfer curve or characteristic curve. Transfer functions for components are used to design and analyze systems assembled from components, particularly using the block diagram technique, in electronics and control theory.

The Nyquist–Shannon sampling theorem is a theorem in the field of signal processing which serves as a fundamental bridge between continuous-time signals and discrete-time signals. It establishes a sufficient condition for a sample rate that permits a discrete sequence of samples to capture all the information from a continuous-time signal of finite bandwidth.

In mathematics, the Fourier transform (FT) is a transform that converts a function into a form that describes the frequencies present in the original function. The output of the transform is a complex-valued function of frequency. The term Fourier transform refers to both this complex-valued function and the mathematical operation. When a distinction needs to be made the Fourier transform is sometimes called the frequency domain representation of the original function. The Fourier transfrom is analogous to decomposing the sound of a musical chord into terms of the intensity of its constituent pitches.
Analog signal processing is a type of signal processing conducted on continuous analog signals by some analog means. "Analog" indicates something that is mathematically represented as a set of continuous values. This differs from "digital" which uses a series of discrete quantities to represent signal. Analog values are typically represented as a voltage, electric current, or electric charge around components in the electronic devices. An error or noise affecting such physical quantities will result in a corresponding error in the signals represented by such physical quantities.

The short-time Fourier transform (STFT), is a Fourier-related transform used to determine the sinusoidal frequency and phase content of local sections of a signal as it changes over time. In practice, the procedure for computing STFTs is to divide a longer time signal into shorter segments of equal length and then compute the Fourier transform separately on each shorter segment. This reveals the Fourier spectrum on each shorter segment. One then usually plots the changing spectra as a function of time, known as a spectrogram or waterfall plot, such as commonly used in software defined radio (SDR) based spectrum displays. Full bandwidth displays covering the whole range of an SDR commonly use fast Fourier transforms (FFTs) with 2^24 points on desktop computers.
In mathematics and signal processing, the Hilbert transform is a specific singular integral that takes a function, u(t) of a real variable and produces another function of a real variable H(u)(t). The Hilbert transform is given by the Cauchy principal value of the convolution with the function (see § Definition). The Hilbert transform has a particularly simple representation in the frequency domain: It imparts a phase shift of ±90° (π⁄2 radians) to every frequency component of a function, the sign of the shift depending on the sign of the frequency (see § Relationship with the Fourier transform). The Hilbert transform is important in signal processing, where it is a component of the analytic representation of a real-valued signal u(t). The Hilbert transform was first introduced by David Hilbert in this setting, to solve a special case of the Riemann–Hilbert problem for analytic functions.
In mathematics and signal processing, an analytic signal is a complex-valued function that has no negative frequency components. The real and imaginary parts of an analytic signal are real-valued functions related to each other by the Hilbert transform.
In mathematics, the discrete-time Fourier transform (DTFT) is a form of Fourier analysis that is applicable to a sequence of values.

In mathematics, a Dirac comb is a periodic function with the formula

A pulse wave or pulse train is a type of non-sinusoidal waveform that includes square waves and similarly periodic but asymmetrical waves. It is a term used in synthesizer programming, and is a typical waveform available on many synthesizers. The exact shape of the wave is determined by the duty cycle or pulse width of the oscillator output. In many synthesizers, the duty cycle can be modulated for a more dynamic timbre. The pulse wave is also known as the rectangular wave, the periodic version of the rectangular function.

The Gabor transform, named after Dennis Gabor, is a special case of the short-time Fourier transform. It is used to determine the sinusoidal frequency and phase content of local sections of a signal as it changes over time. The function to be transformed is first multiplied by a Gaussian function, which can be regarded as a window function, and the resulting function is then transformed with a Fourier transform to derive the time-frequency analysis. The window function means that the signal near the time being analyzed will have higher weight. The Gabor transform of a signal x(t) is defined by this formula:
In mathematical analysis and applications, multidimensional transforms are used to analyze the frequency content of signals in a domain of two or more dimensions.
The spectrum of a chirp pulse describes its characteristics in terms of its frequency components. This frequency-domain representation is an alternative to the more familiar time-domain waveform, and the two versions are mathematically related by the Fourier transform.
The spectrum is of particular interest when pulses are subject to signal processing. For example, when a chirp pulse is compressed by its matched filter, the resulting waveform contains not only a main narrow pulse but, also, a variety of unwanted artifacts many of which are directly attributable to features in the chirp's spectral characteristics.
The simplest way to derive the spectrum of a chirp, now that computers are widely available, is to sample the time-domain waveform at a frequency well above the Nyquist limit and call up an FFT algorithm to obtain the desired result. As this approach was not an option for the early designers, they resorted to analytic analysis, where possible, or to graphical or approximation methods, otherwise. These early methods still remain helpful, however, as they give additional insight into the behavior and properties of chirps.
The chirp pulse compression process transforms a long duration frequency-coded pulse into a narrow pulse of greatly increased amplitude. It is a technique used in radar and sonar systems because it is a method whereby a narrow pulse with high peak power can be derived from a long duration pulse with low peak power. Furthermore, the process offers good range resolution because the half-power beam width of the compressed pulse is consistent with the system bandwidth.

Phase stretch transform (PST) is a computational approach to signal and image processing. One of its utilities is for feature detection and classification. PST is related to time stretch dispersive Fourier transform. It transforms the image by emulating propagation through a diffractive medium with engineered 3D dispersive property. The operation relies on symmetry of the dispersion profile and can be understood in terms of dispersive eigenfunctions or stretch modes. PST performs similar functionality as phase-contrast microscopy, but on digital images. PST can be applied to digital images and temporal data. It is a physics-based feature engineering algorithm.
The problem of reconstructing a multidimensional signal from its projection is uniquely multidimensional, having no 1-D counterpart. It has applications that range from computer-aided tomography to geophysical signal processing. It is a problem which can be explored from several points of view—as a deconvolution problem, a modeling problem, an estimation problem, or an interpolation problem.
Multiresolution Fourier Transform is an integral fourier transform that represents a specific wavelet-like transform with a fully scalable modulated window, but not all possible translations.


