
Atomic absorption spectroscopy (AAS) and atomic emission spectroscopy (AES) is a spectroanalytical procedure for the quantitative determination of chemical elements using the absorption of optical radiation (light) by free atoms in the gaseous state. Atomic absorption spectroscopy is based on absorption of light by free metallic ions.

Spectroscopy is the study of the interaction between matter and electromagnetic radiation as a function of the wavelength or frequency of the radiation. Historically, spectroscopy originated as the study of the wavelength dependence of the absorption by gas phase matter of visible light dispersed by a prism. We can also consider matter waves and acoustic waves as forms of radiative energy, and recently gravitational waves have been associated with a spectral signature in the context of the Laser Interferometer Gravitational-Wave Observatory (LIGO).
An optical spectrometer is an instrument used to measure properties of light over a specific portion of the electromagnetic spectrum, typically used in spectroscopic analysis to identify materials. The variable measured is most often the light's intensity but could also, for instance, be the polarization state. The independent variable is usually the wavelength of the light or a unit directly proportional to the photon energy, such as reciprocal centimeters or electron volts, which has a reciprocal relationship to wavelength.
Ultraviolet–visible spectroscopy or ultraviolet–visible spectrophotometry refers to absorption spectroscopy or reflectance spectroscopy in part of the ultraviolet and the full, adjacent visible spectral regions. This means it uses light in the visible and adjacent ranges. The absorption or reflectance in the visible range directly affects the perceived color of the chemicals involved. In this region of the electromagnetic spectrum, atoms and molecules undergo electronic transitions. Absorption spectroscopy is complementary to fluorescence spectroscopy, in that fluorescence deals with transitions from the excited state to the ground state, while absorption measures transitions from the ground state to the excited state.

The emission spectrum of a chemical element or chemical compound is the spectrum of frequencies of electromagnetic radiation emitted due to an atom or molecule making a transition from a high energy state to a lower energy state. The photon energy of the emitted photon is equal to the energy difference between the two states. There are many possible electron transitions for each atom, and each transition has a specific energy difference. This collection of different transitions, leading to different radiated wavelengths, make up an emission spectrum. Each element's emission spectrum is unique. Therefore, spectroscopy can be used to identify elements in matter of unknown composition. Similarly, the emission spectra of molecules can be used in chemical analysis of substances.

Absorption spectroscopy refers to spectroscopic techniques that measure the absorption of radiation, as a function of frequency or wavelength, due to its interaction with a sample. The sample absorbs energy, i.e., photons, from the radiating field. The intensity of the absorption varies as a function of frequency, and this variation is the absorption spectrum. Absorption spectroscopy is performed across the electromagnetic spectrum.

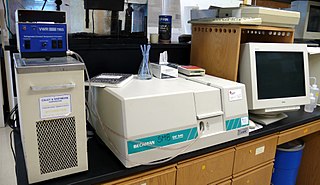
Spectrophotometry is a branch of electromagnetic spectroscopy concerned with the quantitative measurement of the reflection or transmission properties of a material as a function of wavelength. Spectrophotometry uses photometers, known as spectrophotometers, that can measure the intensity of a light beam at different wavelengths. Although spectrophotometry is most commonly applied to ultraviolet, visible, and infrared radiation, modern spectrophotometers can interrogate wide swaths of the electromagnetic spectrum, including x-ray, ultraviolet, visible, infrared, and/or microwave wavelengths.

X-ray spectroscopy is a general term for several spectroscopic techniques for characterization of materials by using x-ray excitation.
Spectral signature is the variation of reflectance or emittance of a material with respect to wavelengths. The spectral signature of stars indicates the composition of the stellar atmosphere. The spectral signature of an object is a function of the incidental EM wavelength and material interaction with that section of the electromagnetic spectrum.
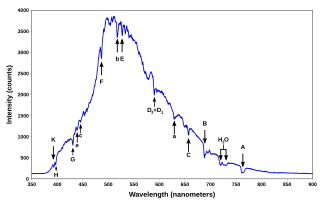
A spectroradiometer is a light measurement tool that is able to measure both the wavelength and amplitude of the light emitted from a light source. Spectrometers discriminate the wavelength based on the position the light hits at the detector array allowing the full spectrum to be obtained with a single acquisition. Most spectrometers have a base measurement of counts which is the un-calibrated reading and is thus impacted by the sensitivity of the detector to each wavelength. By applying a calibration, the spectrometer is then able to provide measurements of spectral irradiance, spectral radiance and/or spectral flux. This data is also then used with built in or PC software and numerous algorithms to provide readings or Irradiance (W/cm2), Illuminance, Radiance (W/sr), Luminance (cd), Flux, Chromaticity, Color Temperature, Peak and Dominant Wavelength. Some more complex spectrometer software packages also allow calculation of PAR µmol/m²/s, Metamerism, and candela calculations based on distance and include features like 2- and 20-degree observer, baseline overlay comparisons, transmission and reflectance.
Hyperspectral imaging, like other spectral imaging, collects and processes information from across the electromagnetic spectrum. The goal of hyperspectral imaging is to obtain the spectrum for each pixel in the image of a scene, with the purpose of finding objects, identifying materials, or detecting processes. There are three general branches of spectral imagers. There are push broom scanners and the related whisk broom scanners, which read images over time, band sequential scanners, which acquire images of an area at different wavelengths, and snapshot hyperspectral imaging, which uses a staring array to generate an image in an instant.

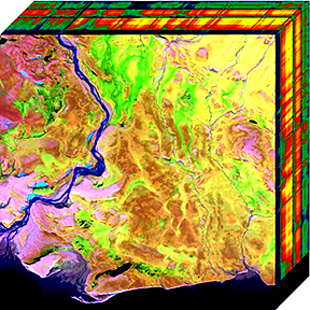
An imaging spectrometer is an instrument used in hyperspectral imaging and imaging spectroscopy to acquire a spectrally-resolved image of an object or scene, often referred to as a datacube due to the three-dimensional representation of the data. Two axes of the image corresponds to vertical and horizontal distance and the third to wavelength. The principle of operation is the same as that of the simple spectrometer, but special care is taken to avoid optical aberrations for better image quality.
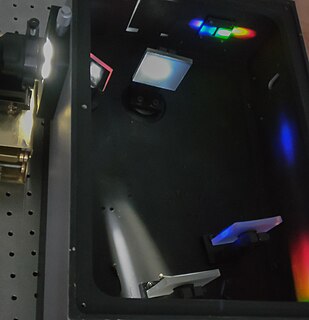
In optics, a dispersive prism is an optical prism, usually having the shape of a geometrical triangular prism, used as a spectroscopic component. Spectral dispersion is the best known property of optical prisms, although not the most frequent purpose of using optical prisms in practice. Triangular prisms are used to disperse light, that is, to break light up into its spectral components. Different wavelengths (colors) of light will be deflected by the prism at different angles, producing a spectrum on a detector. This is a result of the prism's material index of refraction varying with wavelength. By application of Snell's law, one can see that as the wavelength changes, and the refractive index changes, the deflection angle of a light beam will change, separating the colors of the light spatially. Generally, longer wavelengths (red) thereby undergo a smaller deviation than shorter wavelengths (blue) where the refractive index is larger.
Chemical imaging is the analytical capability to create a visual image of components distribution from simultaneous measurement of spectra and spatial, time information. Hyperspectral imaging measures contiguous spectral bands, as opposed to multispectral imaging which measures spaced spectral bands.
Multivariate optical computing, also known as molecular factor computing, is an approach to the development of compressed sensing spectroscopic instruments, particularly for industrial applications such as process analytical support. "Conventional" spectroscopic methods often employ multivariate and chemometric methods, such as multivariate calibration, pattern recognition, and classification, to extract analytical information from data collected at many different wavelengths. Multivariate optical computing uses an optical computer to analyze the data as it is collected. The goal of this approach is to produce instruments which are simple and rugged, yet retain the benefits of multivariate techniques for the accuracy and precision of the result.
Atomic emission spectroscopy (AES) is a method of chemical analysis that uses the intensity of light emitted from a flame, plasma, arc, or spark at a particular wavelength to determine the quantity of an element in a sample. The wavelength of the atomic spectral line in the emission spectrum gives the identity of the element while the intensity of the emitted light is proportional to the number of atoms of the element. The sample may be excited by various methods.

Fourier-transform infrared spectroscopy (FTIR) is a technique used to obtain an infrared spectrum of absorption or emission of a solid, liquid or gas. An FTIR spectrometer simultaneously collects high-spectral-resolution data over a wide spectral range. This confers a significant advantage over a dispersive spectrometer, which measures intensity over a narrow range of wavelengths at a time.
Stationary-wave integrated Fourier-transform spectrometry (SWIFTS), or standing-wave integrated Fourier-transform spectrometry, is an analytical technique used for measuring the distribution of light across an optical spectrum. SWIFTS technology is based on a near-field Lippmann architecture. An optical signal is injected into a waveguide and ended by a mirror. The input signal interferes with the reflected signal, creating a standing, or stationary, wave.

A spectrometer is a scientific instrument used to separate and measure spectral components of a physical phenomenon. Spectrometer is a broad term often used to describe instruments that measure a continuous variable of a phenomenon where the spectral components are somehow mixed. In visible light a spectrometer can separate white light and measure individual narrow bands of color, called a spectrum. A mass spectrometer measures the spectrum of the masses of the atoms or molecules present in a gas. The first spectrometers were used to split light into an array of separate colors. Spectrometers were developed in early studies of physics, astronomy, and chemistry. The capability of spectroscopy to determine chemical composition drove its advancement and continues to be one of its primary uses. Spectrometers are used in astronomy to analyze the chemical composition of stars and planets, and spectrometers gather data on the origin of the universe.
Ultraviolet-visible (UV-Vis) absorption spectroelectrochemistry (SEC) is a multiresponse technique that analyzes the evolution of the absorption spectra in UV-Vis regions during an electrode process. This technique provides information from an electrochemical and spectroscopic point of view. In this way, it enables a better perception about the chemical system of interest. On one hand, molecular information related to the electronic levels of the molecules is obtained from the evolution of the spectra. On the other hand, kinetic and thermodynamic information of the processes is obtained from the electrochemical signal.