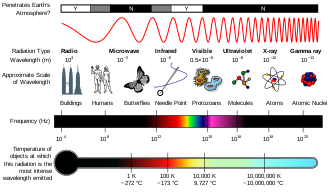
Spectrum

Last updated

The spectrum in a rainbow Rainbow above Kaviskis Lake, Lithuania.jpg
The spectrum in a rainbow

A spectrum (pl.: spectra or spectrums) [1] is a condition that is not limited to a specific set of values but can vary, without gaps, across a continuum. The word spectrum was first used scientifically in optics to describe the rainbow of colors in visible light after passing through a prism. As scientific understanding of light advanced, it came to apply to the entire electromagnetic spectrum. It thereby became a mapping of a range of magnitudes (wavelengths) to a range of qualities, which are the perceived "colors of the rainbow" and other properties which correspond to wavelengths that lie outside of the visible light spectrum.

Contents

Spectrum has since been applied by analogy to topics outside optics. Thus, one might talk about the "spectrum of political opinion", or the "spectrum of activity" of a drug, or the "autism spectrum". In these uses, values within a spectrum may not be associated with precisely quantifiable numbers or definitions. Such uses imply a broad range of conditions or behaviors grouped together and studied under a single title for ease of discussion. Nonscientific uses of the term spectrum are sometimes misleading. For instance, a single left–right spectrum of political opinion does not capture the full range of people's political beliefs. Political scientists use a variety of biaxial and multiaxial systems to more accurately characterize political opinion.

In most modern usages of spectrum there is a unifying theme between the extremes at either end. This was not always true in older usage.

Etymology

In Latin, spectrum means "image" or "apparition", including the meaning "spectre". Spectral evidence is testimony about what was done by spectres of persons not present physically, or hearsay evidence about what ghosts or apparitions of Satan said. It was used to convict a number of persons of witchcraft at Salem, Massachusetts in the late 17th century. The word "spectrum" [Spektrum] was strictly used to designate a ghostly optical afterimage by Goethe in his Theory of Colors and Schopenhauer in On Vision and Colors .

The prefix "spectro-" is used to form words relating to spectra. For example, a spectrometer is a device used to record spectra and spectroscopy is the use of a spectrometer for chemical analysis.

Physical sciences

Diagram illustrating the electromagnetic spectrum EM Spectrum Properties edit.svg
Diagram illustrating the electromagnetic spectrum

In the physical sciences, the term spectrum was introduced first into optics by Isaac Newton in the 17th century, referring to the range of colors observed when white light was dispersed through a prism. [2] [3] Soon the term referred to a plot of light intensity or power as a function of frequency or wavelength, also known as a spectral density plot.

Later it expanded to apply to other waves, such as sound waves and sea waves that could also be measured as a function of frequency (e.g., noise spectrum, sea wave spectrum). It has also been expanded to more abstract "signals", whose power spectrum can be analyzed and processed. The term now applies to any signal that can be measured or decomposed along a continuous variable, such as energy in electron spectroscopy or mass-to-charge ratio in mass spectrometry. Spectrum is also used to refer to a graphical representation of the signal as a function of the dependent variable.

Biological science

Antibiotic spectrum of activity is a component of antibiotic classification. A broad-spectrum antibiotic is active against a wide range of bacteria, [4] whereas a narrow-spectrum antibiotic is effective against specific families of bacteria. [5] An example of a commonly used broad-spectrum antibiotic is ampicillin. [5] An example of a narrow spectrum antibiotic is Dicloxacillin, which acts on beta-lactamase-producing Gram-positive bacteria such as Staphylococcus aureus . [6]

In psychiatry, the spectrum approach uses the term spectrum to describe a range of linked conditions, sometimes also extending to include singular symptoms and traits. For example, the autism spectrum describes a range of conditions classified as neurodevelopmental disorders.

Mathematics

In mathematics, the spectrum of a matrix is the multiset of the eigenvalues of the matrix.

In functional analysis, the concept of the spectrum of a bounded operator is a generalization of the eigenvalue concept for matrices.

In algebraic topology, a spectrum is an object representing a generalized cohomology theory.

Social science

A Nolan chart of the political spectrum using (red leftism and blue rightism) coding Political-spectrum-multiaxis.png
A Nolan chart of the political spectrum using (red leftism and blue rightism) coding

In social science, economic spectrum is used to indicate the range of social class along some indicator of wealth or income. In political science, the term political spectrum refers to a system of classifying political positions in one or more dimensions, for example in a range including right wing and left wing.

Related Research Articles

<span class="mw-page-title-main">Color</span> Visual perception of the light spectrum

Color or colour is the visual perception based on the electromagnetic spectrum. Though color is not an inherent property of matter, color perception is related to an object's light absorption, reflection, emission spectra and interference. For most humans, colors are perceived in the visible light spectrum with three types of cone cells (trichromacy). Other animals may have a different number of cone cell types or have eyes sensitive to different wavelength, such as bees that can distinguish ultraviolet, and thus have a different color sensitivity range. Animal perception of color originates from different light wavelength or spectral sensitivity in cone cell types, which is then processed by the brain.

<span class="mw-page-title-main">Spectroscopy</span> Study involving matter and electromagnetic radiation

Spectroscopy is the field of study that measures and interprets electromagnetic spectra. In narrower contexts, spectroscopy is the precise study of color as generalized from visible light to all bands of the electromagnetic spectrum.

<span class="mw-page-title-main">Optical spectrometer</span> Instrument to measure the properties of visible light

An optical spectrometer is an instrument used to measure properties of light over a specific portion of the electromagnetic spectrum, typically used in spectroscopic analysis to identify materials. The variable measured is most often the irradiance of the light but could also, for instance, be the polarization state. The independent variable is usually the wavelength of the light or a closely derived physical quantity, such as the corresponding wavenumber or the photon energy, in units of measurement such as centimeters, reciprocal centimeters, or electron volts, respectively.

<span class="mw-page-title-main">Visible spectrum</span> Portion of the electromagnetic spectrum that is visible to the human eye

The visible spectrum is the band of the electromagnetic spectrum that is visible to the human eye. Electromagnetic radiation in this range of wavelengths is called visible light. The optical spectrum is sometimes considered to be the same as the visible spectrum, but some authors define the term more broadly, to include the ultraviolet and infrared parts of the electromagnetic spectrum as well.

Fourier-transform spectroscopy is a measurement technique whereby spectra are collected based on measurements of the coherence of a radiative source, using time-domain or space-domain measurements of the radiation, electromagnetic or not. It can be applied to a variety of types of spectroscopy including optical spectroscopy, infrared spectroscopy, nuclear magnetic resonance (NMR) and magnetic resonance spectroscopic imaging (MRSI), mass spectrometry and electron spin resonance spectroscopy.

<span class="mw-page-title-main">Astronomical spectroscopy</span> Study of astronomy using spectroscopy to measure the spectrum of electromagnetic radiation

Astronomical spectroscopy is the study of astronomy using the techniques of spectroscopy to measure the spectrum of electromagnetic radiation, including visible light, ultraviolet, X-ray, infrared and radio waves that radiate from stars and other celestial objects. A stellar spectrum can reveal many properties of stars, such as their chemical composition, temperature, density, mass, distance and luminosity. Spectroscopy can show the velocity of motion towards or away from the observer by measuring the Doppler shift. Spectroscopy is also used to study the physical properties of many other types of celestial objects such as planets, nebulae, galaxies, and active galactic nuclei.

<span class="mw-page-title-main">Emission spectrum</span> Frequencies of light emitted by atoms or chemical compounds

The emission spectrum of a chemical element or chemical compound is the spectrum of frequencies of electromagnetic radiation emitted due to electrons making a transition from a high energy state to a lower energy state. The photon energy of the emitted photons is equal to the energy difference between the two states. There are many possible electron transitions for each atom, and each transition has a specific energy difference. This collection of different transitions, leading to different radiated wavelengths, make up an emission spectrum. Each element's emission spectrum is unique. Therefore, spectroscopy can be used to identify elements in matter of unknown composition. Similarly, the emission spectra of molecules can be used in chemical analysis of substances.

<span class="mw-page-title-main">Absorption spectroscopy</span> Spectroscopic techniques that measure the absorption of radiation

Absorption spectroscopy is spectroscopy that involves techniques that measure the absorption of electromagnetic radiation, as a function of frequency or wavelength, due to its interaction with a sample. The sample absorbs energy, i.e., photons, from the radiating field. The intensity of the absorption varies as a function of frequency, and this variation is the absorption spectrum. Absorption spectroscopy is performed across the electromagnetic spectrum.

<span class="mw-page-title-main">Fluorescence spectroscopy</span> Type of electromagnetic spectroscopy

Fluorescence spectroscopy is a type of electromagnetic spectroscopy that analyzes fluorescence from a sample. It involves using a beam of light, usually ultraviolet light, that excites the electrons in molecules of certain compounds and causes them to emit light; typically, but not necessarily, visible light. A complementary technique is absorption spectroscopy. In the special case of single molecule fluorescence spectroscopy, intensity fluctuations from the emitted light are measured from either single fluorophores, or pairs of fluorophores.

<i>Opticks</i> Book by Isaac Newton

Opticks: or, A Treatise of the Reflexions, Refractions, Inflexions and Colours of Light is a book by Isaac Newton that was published in English in 1704. The book analyzes the fundamental nature of light by means of the refraction of light with prisms and lenses, the diffraction of light by closely spaced sheets of glass, and the behaviour of color mixtures with spectral lights or pigment powders. Opticks was Newton's second major book on physical science and it is considered one of the three major works on optics during the Scientific Revolution. Newton's name did not appear on the title page of the first edition of Opticks.

<span class="mw-page-title-main">Color wheel</span> Illustrative organization of color hues

A color wheel or color circle is an abstract illustrative organization of color hues around a circle, which shows the relationships between primary colors, secondary colors, tertiary colors etc.

<span class="mw-page-title-main">X-ray spectroscopy</span> Technique to characterize materials using X-ray radiation

X-ray spectroscopy is a general term for several spectroscopic techniques for characterization of materials by using x-ray radiation.

<span class="mw-page-title-main">Hyperspectral imaging</span> Multi-wavelength imaging method

Hyperspectral imaging collects and processes information from across the electromagnetic spectrum. The goal of hyperspectral imaging is to obtain the spectrum for each pixel in the image of a scene, with the purpose of finding objects, identifying materials, or detecting processes. There are three general types of spectral imagers. There are push broom scanners and the related whisk broom scanners, which read images over time, band sequential scanners, which acquire images of an area at different wavelengths, and snapshot hyperspectral imagers, which uses a staring array to generate an image in an instant.

<span class="mw-page-title-main">Dispersive prism</span> Device used to disperse light

In optics, a dispersive prism is an optical prism that is used to disperse light, that is, to separate light into its spectral components. Different wavelengths (colors) of light will be deflected by the prism at different angles. This is a result of the prism material's index of refraction varying with wavelength (dispersion). Generally, longer wavelengths (red) undergo a smaller deviation than shorter wavelengths (blue). The dispersion of white light into colors by a prism led Sir Isaac Newton to conclude that white light consisted of a mixture of different colors.

A multivariate optical element (MOE), is the key part of a multivariate optical computer; an alternative to conventional spectrometry for the chemical analysis of materials.

<span class="mw-page-title-main">Fourier-transform infrared spectroscopy</span> Technique to analyze the infrared spectrum of matter

Fourier-transform infrared spectroscopy (FTIR) is a technique used to obtain an infrared spectrum of absorption or emission of a solid, liquid, or gas. An FTIR spectrometer simultaneously collects high-resolution spectral data over a wide spectral range. This confers a significant advantage over a dispersive spectrometer, which measures intensity over a narrow range of wavelengths at a time.

<span class="mw-page-title-main">History of spectroscopy</span>

Modern spectroscopy in the Western world started in the 17th century. New designs in optics, specifically prisms, enabled systematic observations of the solar spectrum. Isaac Newton first applied the word spectrum to describe the rainbow of colors that combine to form white light. During the early 1800s, Joseph von Fraunhofer conducted experiments with dispersive spectrometers that enabled spectroscopy to become a more precise and quantitative scientific technique. Since then, spectroscopy has played and continues to play a significant role in chemistry, physics and astronomy. Fraunhofer observed and measured dark lines in the Sun's spectrum, which now bear his name although several of them were observed earlier by Wollaston.

<span class="mw-page-title-main">Spectrometer</span> Used to measure spectral components of light

A spectrometer is a scientific instrument used to separate and measure spectral components of a physical phenomenon. Spectrometer is a broad term often used to describe instruments that measure a continuous variable of a phenomenon where the spectral components are somehow mixed. In visible light a spectrometer can separate white light and measure individual narrow bands of color, called a spectrum. A mass spectrometer measures the spectrum of the masses of the atoms or molecules present in a gas. The first spectrometers were used to split light into an array of separate colors. Spectrometers were developed in early studies of physics, astronomy, and chemistry. The capability of spectroscopy to determine chemical composition drove its advancement and continues to be one of its primary uses. Spectrometers are used in astronomy to analyze the chemical composition of stars and planets, and spectrometers gather data on the origin of the universe.

In physics, monochromatic radiation is electromagnetic radiation with a single constant frequency or wavelength. When that frequency is part of the visible spectrum the term monochromatic light is often used. Monochromatic light is perceived by the human eye as a spectral color.

<span class="mw-page-title-main">Spectrum (physical sciences)</span> Concept relating to waves and signals

In the physical sciences, the term spectrum was introduced first into optics by Isaac Newton in the 17th century, referring to the range of colors observed when white light was dispersed through a prism. Soon the term referred to a plot of light intensity or power as a function of frequency or wavelength, also known as a spectral density plot.

References

  1. Dictionary.com Archived February 23, 2008, at the Wayback Machine . The American Heritage Dictionary of the English Language, Fourth Edition. Houghton Mifflin Company, 2004. (accessed: January 25, 2008).
  2. Open Access logo PLoS transparent.svg OpenStax Astronomy, "Spectroscopy in Astronomy". OpenStax CNX. September 29, 2016 "OpenStax CNX". Archived from the original on February 17, 2017. Retrieved February 17, 2017.
  3. Newton, Isaac (1671). "A letter of Mr. Isaac Newton … containing his new theory about light and colours …". Philosophical Transactions of the Royal Society of London. 6 (80): 3075–3087. Bibcode:1671RSPT....6.3075N. doi: 10.1098/rstl.1671.0072 . The word "spectrum" to describe a band of colors that has been produced, by refraction or diffraction, from a beam of light first appears on p. 3076.
  4. Taber, Clarence Wilbur (1993). Thomas, Clayton L. (ed.). Taber's cyclopedic medical dictionary (Ed. 17, illustrated, 3. print ed.). Philadelphia: F. A. Davis. ISBN   978-0-8036-8313-6.
  5. 1 2 S.J. Hopkins, Drugs and Pharmacology for Nurses 12th ed., 1997 ( ISBN   0-443-05249 2)
  6. Miranda-Novales G, Leaños-Miranda BE, Vilchis-Pérez M, Solórzano-Santos F (2006). "In vitro activity effects of combinations of cephalothin, dicloxacillin, imipenem, vancomycin and amikacin against methicillin-resistant Staphylococcus spp. strains". Ann. Clin. Microbiol. Antimicrob. 5: 25. doi: 10.1186/1476-0711-5-25 . PMC   1617116 . PMID   17034644.