Study involving matter and electromagnetic radiation
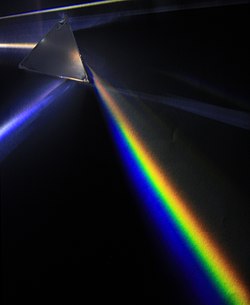
A prism separates white light by dispersing it into its component colors, which can then be studied using spectroscopy.
Spectroscopy is the field of study that measures and interprets electromagnetic spectra as it interacts with matter.[1] In narrower contexts, spectroscopy is the precise study of color as generalized from radiated visible light to all bands of the electromagnetic spectrum.
Spectroscopy, primarily in the electromagnetic spectrum, is a fundamental exploratory tool in the fields of astronomy, chemistry, materials science, and physics, allowing the composition, physical and electronic structure of matter to be investigated at the atomic, molecular and macro scale, and over astronomical distances.
Spectroscopy is a branch of science concerned with the spectra of electromagnetic radiation as a function of its wavelength or frequency, as measured by spectrographic equipment and other techniques, in order to obtain information concerning the structure and properties of matter.[3] Spectral measurement devices are referred to as spectrometers, spectrophotometers, spectrographs or spectral analyzers. Most spectroscopic analysis in the laboratory starts with a sample to be analyzed. A light source is sent through a monochromator to spatially separate the colors before passing a selected frequency band through the sample, then the output is captured by a photodiode.[4] For astronomical purposes, the telescope must be equipped with the light dispersion device.[5] There are various versions of this basic setup that may be employed.
High resolution spectrum of the Sun, showing the discrete line pattern created by elements in the stellar atmosphere
Spectroscopy began with Isaac Newton splitting light with a prism; a key moment in the development of modern optics.[6] Therefore, it was originally the study of visible light that we call color. Following the contributions of James Clerk Maxwell, this study later came to include the entire electromagnetic spectrum.[7] Although color is involved in spectroscopy, it is not equivalent to the absorption and reflection of certain electromagnetic waves that give objects or elements a sense of color to our eyes. Rather, spectroscopy involves the splitting of light by a prism, diffraction grating, or similar instrument, to display a particular discrete line pattern called a "spectrum", which is unique for each different type of element or molecule. Most elements are first put into a gaseous state to allow the spectra to be examined, although today other methods can be used for different phases of matter. Each element that is diffracted by a prism-like instrument displays either an absorption spectrum or an emission spectrum depending upon whether the element is being cooled or heated.[8]
Until recently all spectroscopy involved the study of line spectra and most spectroscopy still does.[9] Vibrational spectroscopy is the branch of spectroscopy that studies the spectra.[10] However, the latest developments in spectroscopy can sometimes dispense with the dispersion technique. In biochemical spectroscopy, information can be gathered about biological tissue by absorption and light scattering techniques. Light scattering spectroscopy is a type of reflectance spectroscopy that determines tissue structures by examining elastic scattering.[11] In such a case, it is the tissue that acts as a diffraction or dispersion mechanism.
Spectroscopic studies were central to the development of quantum mechanics. The first useful quantum atomic models, including Bohr model, the Schrödinger equation, and Matrix mechanics, reproduced the spectral lines of hydrogen. These equated discrete quantum jumps of the bound electron in a hydrogen atom to the discrete hydrogen spectrum. Max Planck's explanation of blackbody radiation involved spectroscopy because he was comparing the wavelength of light using a photometer to the temperature of a Black Body.[12] Spectroscopy is used in physical and analytical chemistry because atoms and molecules have unique spectra. As a result, these spectra can be used to detect, identify and quantify information about the atoms and molecules.
Spectroscopy is used in astronomy and remote sensing on Earth. Most research telescopes have spectrographs. The measured spectra are used to determine the chemical composition and physical properties of astronomical objects, such as their temperature, elemental abundances, velocity, rotation, magnetic field, and more.[13] An important use for spectroscopy is in biochemistry. Molecular samples may be analyzed for species identification and energy content.[14]
Theory
The underlying premise of spectroscopy is that light is made of different wavelengths and that each wavelength corresponds to a different frequency. The importance of spectroscopy is centered around the fact that every element in the periodic table has a unique light spectrum described by the frequencies of light it emits or absorbs consistently appearing in the same part of the electromagnetic spectrum when that light is diffracted.[15] This opened up an entire field of study with anything that contains atoms. Spectroscopy is the key to understanding the atomic properties of all matter. As such spectroscopy opened up many new sub-fields of science yet undiscovered. The idea that each atomic element has its unique spectral signature enabled spectroscopy to be used in a broad number of fields each with a specific goal achieved by different spectroscopic procedures. The National Institute of Standards and Technology maintains a public Atomic Spectra Database that is continually updated with precise measurements.[16]
With an absorption spectrophotometer, the level of absorption of a light source is determined by the Beer-Lambert Law: where is the light intensity before passing through the sample, is the output intensity, is the extinction coefficient, is the path length through the sample, and is the concentration of the sample. The extinction coefficient depends on the wavelength selected and the molecule being sampled.[4]
Resonances by the frequency were first characterized in mechanical systems such as pendulums, which have a frequency of motion noted famously by Galileo.[17] In quantum mechanical systems, the analogous resonance is a coupling of two quantum mechanical stationary states of a system, such as two atomic orbitals, via an oscillatory source of energy such as a photon. The coupling of the two states is strongest when the source energy matches the energy difference between the two states.[citation needed] That is, a photon at the right energy is more likely to cause an electron to jump between two orbitals, a process called electron excitation. The energy E of a photon is related to its frequency ν by E = hν where h is the Planck constant,[18] and so a spectrum of the system response vs. photon frequency will peak at the resonant frequency or energy.
Any part of the electromagnetic spectrum may be used to analyze a sample from the infrared to the ultraviolet telling scientists different properties about the very same sample, a discovery that led to a broadening of the field of spectroscopy. For instance in chemical analysis, the most common types of spectroscopy include atomic spectroscopy, infrared spectroscopy, ultraviolet and visible spectroscopy, Raman spectroscopy and nuclear magnetic resonance.[19] In nuclear magnetic resonance (NMR), the theory behind it is that frequency is analogous to resonance and its corresponding resonant frequency.
Classification of methods
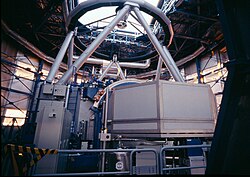
A huge diffraction grating at the heart of the ultra-precise ESPRESSO spectrograph.
Spectroscopy is a sufficiently broad field that many sub-disciplines exist, each with numerous implementations of specific spectroscopic techniques. The various implementations and techniques can be classified in several ways.
Type of radiative energy
The types of spectroscopy are distinguished by the type of radiative energy involved in the interaction. In many applications, the spectrum is determined by measuring changes in the intensity or frequency of this energy. The types of radiative energy studied include:
The types of spectroscopy can be distinguished by the nature of the interaction between the energy and the material. These interactions include:[32]
Absorption spectroscopy: Absorption occurs when energy from the radiative source is absorbed by the material. Absorption is often determined by measuring the fraction of energy transmitted through the material, with absorption decreasing the transmitted portion.
Emission spectroscopy: Emission indicates that radiative energy is released by the material. A material's blackbody spectrum is a spontaneous emission spectrum determined by its temperature. This feature can be measured in the infrared by instruments such as the atmospheric emitted radiance interferometer.[33] Emission can be induced by other sources of energy such as flames, sparks, electric arcs or electromagnetic radiation in the case of fluorescence.
Elastic scattering and reflection spectroscopy determine how incident radiation is reflected or scattered by a material. Crystallography employs the scattering of high energy radiation, such as X-rays and electrons, to examine the arrangement of atoms in proteins and solid crystals.
Inelastic scattering phenomena involve an exchange of energy between X-ray radiation and the matter that shifts the wavelength of the scattered radiation. These include Raman and Compton scattering.[35]
Coherent or resonance spectroscopy are techniques where the radiative energy couples two quantum states of the material in a coherent interaction that is sustained by the radiating field. The coherence can be disrupted by other interactions, such as particle collisions and energy transfer, and so often requires high intensity radiation to be sustained. Nuclear magnetic resonance (NMR) spectroscopy is a widely used resonance method, and ultrafast laser spectroscopy is possible in the infrared and visible spectral regions.
Quantum logic spectroscopy is a general technique used in ion traps that enables precision spectroscopy of ions with internal structures that preclude laser cooling, state manipulation, and detection.[36]Quantum logic operations enable a controllable ion to exchange information with a co-trapped ion that has a complex or unknown electronic structure.
Type of material
Spectroscopic studies are designed so that the radiant energy interacts with specific types of matter. These studies can be divided into three broad categories:[37]electronic spectroscopy, which measures the transition of electrons between different energy states through absorption or emission of visible or ultraviolet energy; vibronic spectroscopy of molecules induced by the absorption of infrared energy; and rotational spectroscopy of molecules caused by microwave energy.[38] The last two can be combined into rotational–vibrational spectroscopy of a gas.
Atoms
Atomic spectra comparison table, from "Spektroskopische Methoden der analytischen Chemie" (1922).
Atomic spectroscopy was the first application of spectroscopy. Atomic absorption spectroscopy and atomic emission spectroscopy involve visible and ultraviolet light. These absorptions and emissions, often referred to as atomic spectral lines, are due to electronic transitions of outer shell electrons as they rise and fall from one electron orbit to another. Atoms have distinct X-ray spectra that are attributable to the excitation of inner shell electrons to excited states.
Atoms of different elements have distinct spectra and therefore atomic spectroscopy allows for the identification and quantitation of a sample's elemental composition. After Robert Bunsen and Gustav Kirchhoff invented the spectroscope, Bunsen discovered cesium and rubidium by observing their emission spectra.[39] Atomic absorption lines are observed in the solar spectrum and referred to as Fraunhofer lines after their discoverer.[40] A comprehensive explanation of the hydrogen spectrum was an early success of quantum mechanics[41] and explained the Lamb shift observed in the hydrogen spectrum,[42] which further led to the development of quantum electrodynamics.
The combination of atoms into molecules leads to the creation of unique types of energetic states and therefore unique spectra of the transitions between these states. Molecular spectra can be obtained due to electron spin states (electron paramagnetic resonance), molecular rotations, molecular vibration, and electronic states. Rotations are collective motions of the atomic nuclei and typically lead to spectra in the microwave and millimetre-wave spectral regions. Rotational spectroscopy and microwave spectroscopy are synonymous. Vibrations are relative motions of the atomic nuclei and are studied by both infrared and Raman spectroscopy. Electronic excitations are studied using visible and ultraviolet spectroscopy as well as fluorescence spectroscopy.[32][48][49][50][51]
Studies in molecular spectroscopy led to the development of the first maser and contributed to the subsequent development of the laser.
Crystals and extended materials
The combination of atoms or molecules into crystals or other extended forms leads to the creation of additional energetic states. These states are numerous and therefore have a high density of states. This high density often makes the spectra weaker and less distinct, i.e., broader.[citation needed] For instance, blackbody radiation is due to the thermal motions of atoms and molecules within a material. Acoustic and mechanical responses are due to collective motions as well.[citation needed] Pure crystals, though, can have distinct spectral transitions, and the crystal arrangement has an effect on the observed molecular spectra. The regular lattice structure of crystals scatters X-rays,[52] electrons,[53] or neutrons,[54] allowing for crystallographic studies.
Auger electron spectroscopy is a method used to study surfaces of materials on a micro-scale. It is often used in connection with electron microscopy.[57]
Force spectroscopy is a set of techniques for the study of the interactions and the binding forces between individual molecules, although the name is somewhat misleading because there is no true matter-radiation interaction.[69]
Hadron spectroscopy studies the energy/mass spectrum of hadrons according to spin, parity, and other particle properties. Baryon spectroscopy and meson spectroscopy are types of hadron spectroscopy.[citation needed]
Multispectral imaging and hyperspectral imaging is a method to create a complete picture of the environment or various objects, each pixel containing a full visible, visible near infrared, near infrared, or infrared spectrum.[72]
Inelastic electron tunneling spectroscopy uses the changes in current due to inelastic electron-vibration interaction at specific energies that can also measure optically forbidden transitions.[73]
Laser-induced breakdown spectroscopy, also called laser-induced plasma spectrometry, is a type of atomic emission spectroscopy which uses a highly energetic laser pulse as the excitation source[75]
Mass spectroscopy is a historical term used to refer to mass spectrometry. The current recommendation is to use the latter term.[79] The term "mass spectroscopy" originated in the use of phosphor screens to detect ions.
Raman optical activity spectroscopy exploits Raman scattering and optical activity effects to reveal detailed information on chiral centers in molecules.
Raman spectroscopy is used to determine vibrational modes of molecules, providing a structural fingerprint by which molecules can be identified.[88]
Saturated spectroscopy uses a dual laser technique to remove the Doppler profiles from spectroscopic signals of hot atoms. It does so by measuring the spectral signal of atoms moving perpendicular to the laser.[89]
Spectrophotometry combines a spectrometer with a photometer to measure the energy intensity at different wavelengths. This can be used to determine the reflection or transmission properties of a substance.[91]
Spin noise spectroscopy traces spontaneous fluctuations of electronic and nuclear spins.[92]
Thermal infrared spectroscopy measures thermal radiation emitted from materials and surfaces and is used to determine the type of bonds present in a sample as well as their lattice environment. The techniques are widely used by organic chemists, mineralogists, and planetary scientists.
Transient grating spectroscopy measures quasiparticle propagation. It can track changes in metallic materials as they are irradiated.
There are several applications of spectroscopy in the fields of medicine, physics, chemistry, and astronomy. Taking advantage of the properties of absorbance and, with astronomy, emission, spectroscopy can be used to identify certain states of nature. The uses of spectroscopy in so many different scientific fields and for so many different applications has led to the creation of specialized subfields. Such examples include:
In-ovo sexing: spectroscopy allows to determine the sex of the egg while it is hatching. Developed by French and German companies, both countries decided to ban chick culling, mostly done through a macerator, in 2022.[109]
The history of spectroscopy began with Isaac Newton's optics experiments (1666–1672). According to Andrew Fraknoi and David Morrison, "In 1672, in the first paper that he submitted to the Royal Society, Isaac Newton described an experiment in which he permitted sunlight to pass through a small hole and then through a prism. Newton found that sunlight, which looks white to us, is actually made up of a mixture of all the colors of the rainbow."[111] Newton applied the word "spectrum" to describe the rainbow of colors that combine to form white light and that are revealed when the white light is passed through a prism.
Fraknoi and Morrison state that "In 1802, William Hyde Wollaston built an improved spectrometer that included a lens to focus the Sun's spectrum on a screen. Upon use, Wollaston realized that the colors were not spread uniformly, but instead had missing patches of colors, which appeared as dark bands in the spectrum."[111] During the early 1800s, Joseph von Fraunhofer made experimental advances with dispersive spectrometers that enabled spectroscopy to become a more precise and quantitative scientific technique. Since then, spectroscopy has played and continues to play a significant role in chemistry, physics, and astronomy. Per Fraknoi and Morrison, "Later, in 1815, German physicist Joseph Fraunhofer examined the solar spectrum, and found about 600 such dark lines (missing colors), are now known as Fraunhofer lines, or Absorption lines."[111][bettersourceneeded]
Spectra of atoms and molecules often consist of a series of spectral lines, each one representing a resonance between two different quantum states. The explanation of these series, and the spectral patterns associated with them, were one of the experimental enigmas that drove the development and acceptance of quantum mechanics. The hydrogen spectral series in particular was first successfully explained by the Rutherford–Bohr quantum model of the hydrogen atom. In some cases spectral lines are well separated and distinguishable, but spectral lines can overlap and appear to be a single transition if the density of energy states is high enough. Named series of lines include the principal, sharp, diffuse and fundamental series.
Hobbyist
Spectroscopy has emerged as a growing practice within the maker movement, enabling hobbyists and educators to construct functional spectrometers using readily available materials.[112] Utilizing components like CD/DVD diffraction gratings, smartphones, and 3D-printed parts, these instruments offer a hands-on approach to understanding light and matter interactions. Smartphone applications[113][114] along with open-source tools[115] facilitate integration, greatly simplify the capturing and analysis of spectral data. While limitations in resolution, calibration accuracy, and stray light management exist compared to professional equipment, DIY spectroscopy provides valuable educational experiences[116] and contributes to citizen science initiatives, fostering accessibility to spectroscopic techniques.
↑Joosten, Heinz-Gerd; Golloch, Alfred; Flock, Jörg; Killewald, Susan (2020). "Introduction". Atomic Emission Spectrometry: AES - Spark, Arc, Laser Excitation. Walter de Gruyter GmbH & Co KG. p.1. doi:10.1515/9783110529692-001 (inactive 15 January 2026). ISBN978-3-11-052969-2.{{cite book}}: CS1 maint: DOI inactive as of January 2026 (link)
↑Sutton, M. A. (1974). "Sir John Herschel and the Development of Spectroscopy in Britain". The British Journal for the History of Science. 7 (1). Cambridge University Press: 42–60. doi:10.1017/S0007087400012851. JSTOR4025175.
↑Lazić, Dejan (2019). "Introduction to Raman Microscopy/Spectroscopy". In Radović, Biljana Vucelić; Lazić, Dejan; Nikšić, Miomir (eds.). Application of Molecular Methods and Raman Microscopy/Spectroscopy in Agricultural Sciences and Food Technology. London: Ubiquity Press. pp.143–50. doi:10.5334/bbj.i. ISBN978-1-911529-52-1. JSTORj.ctvmd85qp.12.
↑Sutula, Maddie (Fall 2018). "Energy, Frequency, and Wavelength"(PDF). 3.091: Introduction to Solid State Chemistry. Massachusetts Institute of Technology. Retrieved 2025-11-27.
↑"A Taste of ESPRESSO". The European Southern Observatory. 14 September 2015. Retrieved 15 September 2015.
↑Townes, C. H. (April 1952). "Microwave Spectroscopy". American Scientist. 40 (2). Sigma Xi, The Scientific Research Honor Society: 270–290. JSTOR27826432.
↑Jepsen, P. U.; Cooke, D. G.; Koch, M. (January 2011). "Terahertz spectroscopy and imaging – Modern techniques and applications". Laser & Photonics Reviews. 5 (1): 124–166. doi:10.1002/lpor.201000011.
↑Ng, Lily M.; Simmons, Reiko (May 20, 1999). "Infrared Spectroscopy". Analytical Chemistry. 71 (12). American Chemical Society: 343–350. doi:10.1021/a1999908r. PMID10384791.
↑Ferrari, Marco; Mottola, Leonardo; Quaresima, Valentina (August 2004). "Principles, Techniques, and Limitations of Near Infrared Spectroscopy". Canadian Journal of Applied Physiology. 29 (4): 463–487. doi:10.1139/h04-031. PMID15328595.
↑Dunn, W. L.; McGregor, D. S.; Shultis, J. K. (2021). "Gamma-Ray Spectroscopy". In Fleck, I.; Titov, M.; Grupen, C.; Buvat, I. (eds.). Handbook of Particle Detection and Imaging. Springer, Cham. pp.515–582. doi:10.1007/978-3-319-93785-4_17. ISBN978-3-319-93784-7.
↑Macdonald, J. R. (1992). "Impedance spectroscopy". Annals of Biomedical Engineering. 20 (3): 289–305. doi:10.1007/BF02368532. PMID1443825.
↑Alexandropoulos, N. G.; Theodoridou, I. (1988). "X-Ray Inelastic Scattering Spectroscopy and Its Applications in Solid State Physics". In Ferreira, J. G.; Ramos, M. T. (eds.). X-Ray Spectroscopy in Atomic and Solid State Physics. NATO ASI Series. Vol.187. Boston, MA.: Springer. pp.279–299. doi:10.1007/978-1-4613-0731-0_13. ISBN978-1-4612-8054-5.
↑Schmidt, P. O.; Rosenband, T.; Langer, C.; Itano, W. M.; Bergquist, J. C.; Wineland, D. J. (July 29, 2005). "Spectroscopy Using Quantum Logic". Science. 309 (5735): 749–752. doi:10.1126/science.1114375.
↑Harrison, W. W.; Hess, K. R.; Marcus, R. K.; King, F. L. (1986). "Glow discharge mass spectrometry". Analytical Chemistry. 58 (2). American Chemical Society: 341A–356A. doi:10.1021/ac00293a002.
↑Rosenkranz, B.; Bettmer, J. (February–March 2000). "Microwave-induced plasma–optical emission spectrometry – fundamental aspects and applications in metal speciation analysis". TrAC Trends in Analytical Chemistry. 19 (2–3): 138–156. doi:10.1016/S0165-9936(99)00189-2.
↑Vayner, B.; Ferguson, D. C.; Galofaro, J. T. (October 2008). "Emission Spectra of Arc Plasmas". IEEE Transactions on Plasma Science. 36 (5): 2219–2227. doi:10.1109/TPS.2008.2001424.
↑Karathanasis, A. D.; Hajek, B. F. (January 1996). "Elemental Analysis by X-Ray Fluorescence Spectroscopy". In Sparks, D. L.; Page, A. L.; Helmke, P. A.; Loeppert, R. H.; Soltanpour, P. N.; Tabatabai, M. A.; Johnston, C. T.; Sumner, M. E. (eds.). Methods of Soil Analysis: Part 3 Chemical Methods. SSSA Book Series. doi:10.2136/sssabookser5.3.c7. ISBN978-0-89118-825-4.
↑Ripoche, J.; Maze, G.; Izbicki, JL (1985). "A new acoustic spectroscopy: Resonance spectroscopy by the MIIR". Journal of Nondestructive Evaluation. 5 (2): 69–79. doi:10.1007/BF00566957.
↑Gunawardane, R. P.; Arumainayagam, C. R. (2006). "Auger Electron Spectroscopy". In Vij, D. (ed.). Handbook of Applied Solid State Spectroscopy. Boston, MA.: Springer. pp.451–483. doi:10.1007/0-387-37590-2_10. ISBN978-0-387-32497-5.
↑Hoffmann, S. V.; Fano, M.; van de Weert, M. (2016). "Circular Dichroism Spectroscopy for Structural Characterization of Proteins". In Müllertz, A.; Perrie, Y.; Rades, T. (eds.). Analytical Techniques in the Pharmaceutical Sciences. Advances in Delivery Science and Technology. New York, NY.: Springer. pp.223–251. doi:10.1007/978-1-4939-4029-5_6. ISBN978-1-4939-4027-1.
↑Wickramaratne, Darshana; Dreyer, Cyrus E.; Monserrat, Bartomeu; Shen, Jimmy-Xuan; Lyons, John L.; Alkauskas, Audrius; Van de Walle, Chris G. (2018). "Defect identification based on first-principles calculations for deep level transient spectroscopy". Applied Physics Letters. 113 (19) 192106. arXiv:1810.05302. doi:10.1063/1.5047808.
↑Volkov, A. A.; Prokhorov, A. S. (2003). "Broadband Dielectric Spectroscopy of Solids". Radiophysics and Quantum Electronics. 46 (8–9): 657–665. doi:10.1023/B:RAQE.0000024994.15881.c9.
↑Escorihuela, Jorge; González-Martínez, Miguel Ángel; López-Paz, José Luis; Puchades, Rosa; Maquieira, Ángel; Gimenez-Romero, David (December 2, 2014). "Dual-Polarization Interferometry: A Novel Technique To Light up the Nanomolecular World". Chemical Reviews. ACS Publications. 115 (1): 265–294. doi:10.1021/cr5002063. PMID25456305.
↑Hofer, F.; Schmidt, F. P.; Grogger, W.; Kothleitner, G. Fundamentals of electron energy-loss spectroscopy. 14th European Workshop on Modern Developments and Applications in Microbeam Analysis (EMAS 2015 Workshop) 3–7 May 2015, Portorož, Slovenia. IOP Conference Series: Materials Science and Engineering. Vol.109. doi:10.1088/1757-899X/109/1/012007.
12Dolomatov, M. Y.; Subkhankulov, V. R.; Dolomatova, M. M.; Kovaleva, E. A.; Vershinin, S. S.; Belotelov, O. A.; Kazaev, I. V. (2025). "Use of Electron Phenomenological Spectroscopy for the Rapid Determination of the Properties of Raw Material for the Preparation of Multifunctional Carbon Materials". Chemistry and Technology of Fuels and Oils. 61 (2): 340–345. doi:10.1007/s10553-025-01872-5.
↑Lancaster, G. (1967). "Electron paramagnetic resonance (a review)". Journal of Materials Science. 2 (5): 489–495. doi:10.1007/BF00562955.
↑Faix, O. (1992). "Fourier Transform Infrared Spectroscopy". In Lin, S. Y.; Dence, C.W. (eds.). Methods in Lignin Chemistry. Springer Series in Wood Science. Berlin, Heidelberg: Springer. pp.83–109. doi:10.1007/978-3-642-74065-7_7. ISBN978-3-642-74067-1.
↑Hudson, Bruce S. (March 24, 2001). "Inelastic Neutron Scattering: A Tool in Molecular Vibrational Spectroscopy and a Test of ab Initio Methods". The Journal of Physical Chemistry A. 105 (16): 3949–3960. doi:10.1021/jp004429o.
↑Orr, Brian; Haub, J. G.; He, Y.; White, R. T. (2016). "Spectroscopic Applications of Pulsed Tunable Optical Parametric Oscillators". In Duarte, F. J. (ed.). Tunable Laser Applications (3rded.). Boca Raton: CRC Press. pp.17–142. ISBN978-1-4822-6106-6.
↑Hüfner, Stefan; Schmidt, Stefan; Reinert, Friedrich (July 21, 2005). "Photoelectron spectroscopy—An overview". Nuclear Instruments and Methods in Physics Research Section A: Accelerators, Spectrometers, Detectors and Associated Equipment. 547 (1). Elsevier: 8–23. doi:10.1016/j.nima.2005.05.008.
↑Stevie, Fred A.; Donley, Carrie L. (2020). "Introduction to x-ray photoelectron spectroscopy". Journal of Vacuum Science & Technology A. 38 (6) 063204. doi:10.1116/6.0000412.
↑Aamodt, L. C.; Murphy, J. C. (1983). "Thermal effects in photothermal spectroscopy and photothermal imaging". Journal of Applied Physics. 54: 581–591. doi:10.1063/1.332062.
↑Beeby, A. (2002). "Pump-Probe Laser Spectroscopy". In Andrews, D. L.; Demidov, A. A. (eds.). An Introduction to Laser Spectroscopy. Boston, MA.: Springer. doi:10.1007/978-1-4615-0727-7_4.
↑Schrader, Bernhard (November 1973). "Chemical Applications of Raman Spectroscopy". Angewandte Chemie. 12 (11): 884–908. doi:10.1002/anie.197308841.
↑Letokhov, V. S. (1976). "Saturation spectroscopy". In Shimoda, K. (ed.). High-Resolution Laser Spectroscopy. Topics in Applied Physics. Vol.13. Berlin, Heidelberg: Springer. doi:10.1007/3540077197_20.
12Zandvliet, Harold J. W.; van Houselt, Arie (July 2009). "Scanning Tunneling Spectroscopy". Annual Review of Analytical Chemistry. 2: 37–55. doi:10.1146/annurev-anchem-060908-155213.
↑Ouellette, Jennifer. "Time-Resolved Spectroscopy Comes of Age"(PDF). The Industrial Physicist. Center for Chemical Dynamics, Case Western Reserve University. pp.16–19. Retrieved 2026-01-05.
↑Clark, Roger N.; Swayze, Gregg A.; Carlson, Robert; Grundy, Will; Noll, Keith (2014). "Spectroscopy from Space". Reviews in Mineralogy and Geochemistry. 78 (1): 399–446. doi:10.2138/rmg.2014.78.10.
↑Druy, Mark A.; Elandjian, Lucy; Stevenson, W. A. (September 6, 1988). Udd, Eric (ed.). Composite Cure Monitoring With Infrared Transmitting Optical Fibers. Fiber Optic Smart Structures and Skins, O-E/Fiber LASE '88, Boston, MA, United States. SPIE Conference Proceedings. Vol.0986. Society of Photo-Optical Instrumentation Engineers. doi:10.1117/12.948895.
↑Cozzolino, Daniel (June 2009). "Near Infrared Spectroscopy in Natural Products Analysis". Planta Medica. 75 (7): 746–756. doi:10.1055/s-0028-1112220. PMID19165716.
↑Bakr, C. A.; Hussein, Z. A. (2025). "Determination of toxic element concentrations in human blood samples using X-ray fluorescence spectroscopy". International Journal of Environmental Analytical Chemistry: 1–17. doi:10.1080/03067319.2025.2565656.
↑Janssens, Koen; De Nolf, Wout; Van Der Snickt, Geert; Vincze, Laszlo; Vekemans, Bart; Terzano, Roberto; Brenker, Frank E. (June 2010). "Recent trends in quantitative aspects of microscopic X-ray fluorescence analysis". Trends in Analytical Chemistry. 29 (6): 464–478. doi:10.1016/j.trac.2010.03.003.
↑Harel, Elad; Fidler, Andrew F.; Engel, Gregory S. (September 1, 2010). "Real-time mapping of electronic structure with single-shot two-dimensional electronic spectroscopy". Proceedings of the National Academy of Sciences. 107 (38): 16444–16447. doi:10.1073/pnas.1007579107. JSTOR20779686.
↑Wuyts, Stijn; van Dokkum, Pieter G.; Franx, Marijn; Schreiber, Natascha M. Förster; Illingworth, Garth D.; Labbé, Ivo; Rudnick, Gregory (2009). "Optical Spectroscopy of Distant Red Galaxies". The Astrophysical Journal. 706 (1): 885. arXiv:0910.1836. doi:10.1088/0004-637X/706/1/885.
This page is based on this Wikipedia article Text is available under the CC BY-SA 4.0 license; additional terms may apply. Images, videos and audio are available under their respective licenses.