Method of determining the quantity of chemical substances
Basic principle of isotope dilution Adding of an isotopically altered standard to the sample changes the natural isotopic composition of the analyte. By measuring the resulting isotopic composition, it is possible to calculate the amount of the analyte present in the sample.
Isotope dilution analysis is a method of determining the quantity of chemical substances. In its most simple conception, the method of isotope dilution comprises the addition of known amounts of isotopically enriched substance to the analyzed sample. Mixing of the isotopic standard with the sample effectively "dilutes" the isotopic enrichment of the standard and this forms the basis for the isotope dilution method. Isotope dilution is classified as a method of internal standardisation, because the standard (isotopically enriched form of analyte) is added directly to the sample. In addition, unlike traditional analytical methods which rely on signal intensity, isotope dilution employs signal ratios. Owing to both of these advantages, the method of isotope dilution is regarded among chemistry measurement methods of the highest metrological standing.[1]
Isotopes are variants of a particular chemical element which differ in neutron number. All isotopes of a given element have the same number of protons in each atom. The term isotope is formed from the Greek roots isos (ἴσος "equal") and topos (τόπος "place"), meaning "the same place"; thus, the meaning behind the name is that different isotopes of a single element occupy the same position on the periodic table.
Early history
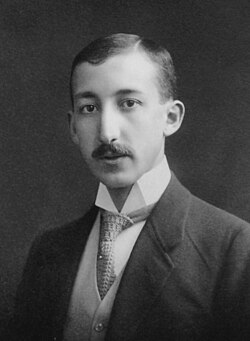
The Hungarian chemist George de Hevesy was awarded the Nobel Prize in Chemistry for development of radiotracer method, which is a forerunner of isotope dilution
Analytical application of the radiotracer method is a forerunner of isotope dilution. This method was developed in the early 20th century by George de Hevesy for which he was awarded the Nobel Prize in Chemistry for 1943.
An early application of isotope dilution in the form of radiotracer method was determination of the solubility of lead sulphide and lead chromate in 1913 by George de Hevesy and Friedrich Adolf Paneth.[2] In the 1930s, US biochemist David Rittenberg pioneered the use of isotope dilution in biochemistry enabling detailed studies of cell metabolism.[3]
Tutorial example
Tutorial illustration of isotope dilution analysis with fish counting in lakes
Isotope dilution is analogous to the mark and recapture method, commonly used in ecology to estimate population size.
For instance, consider the determination of the number of fish (nA) in a lake. For the purpose of this example, assume all fish native to the lake are blue. On their first visit to the lake, an ecologist adds five yellow fish (nB = 5). On their second visit, the ecologist captures a number of fish according to a sampling plan and observes that the ratio of blue-to-yellow (i.e. native-to-marked) fish is 10:1. The number of fish native to the lake can be calculated using the following equation:
This is a simplified view of isotope dilution but it illustrates the method's salient features. A more complex situation arises when the distinction between marked and unmarked fish becomes fuzzy. This can occur, for example, when the lake already contains a small number of marked fish from previous field experiments; and vice versa, where the amount of marked fish added contains a small number of unmarked fish. In a laboratory setting, an unknown (the "lake") may contain a quantity of a compound that is naturally present in major ("blue") and minor ("yellow") isotopic forms. A standard that is enriched in the minor isotopic form may then be added to the unknown, which can be subsequently analyzed. Keeping to the fish analogy, the following expression can be employed:
where, as indicated above, nA and nB represent the number of fish in the lake and the number of fish added to the lake, respectively; RA is the ratio of the native-to-marked fish in the lake prior to the addition of marked fish; RB is the ratio of the native-to-marked fish in the amount of marked fish added to the lake; finally, RAB is the ratio of the native-to-marked fish captured during the second visit.
Applications
Isotope dilution is almost exclusively employed with mass spectrometry in applications where high-accuracy is demanded. For example, all National Metrology Institutes rely significantly on isotope dilution when producing certified reference materials. In addition to high-precision analysis, isotope dilution is applied when low recovery of the analyte is encountered. In addition to the use of stable isotopes, radioactive isotopes can be employed in isotope dilution which is often encountered in biomedical applications, for example, in estimating the volume of blood.
Single dilution method
Isotope dilution notation
Name
Symbol
Analyte
A
Isotopic standard (Spike)
B
Analyte + Spike
AB
Consider a natural analyte rich in isotope iA (denoted as A), and the same analyte, enriched in isotope jA (denoted as B). Then, the obtained mixture is analyzed for the isotopic composition of the analyte, RAB = n(iA)AB/n(jA)AB. If the amount of the isotopically enriched substance (nB) is known, the amount of substance in the sample (nA) can be obtained:[4]
Here, RA is the isotope amount ratio of the natural analyte, RA = n(iA)A/n(jA)A, RB is the isotope amount ratio of the isotopically enriched analyte, RB = n(iA)B/n(jA)B, RAB is the isotope amount ratio of the resulting mixture, x(jA)A is the isotopic abundance of the minor isotope in the natural analyte, and x(jA)B is the isotopic abundance of the major isotope in the isotopically enriched analyte.
For elements with only two stable isotopes, such as boron, chlorine, or silver, the above single dilution equation simplifies to the following:
In a typical gas chromatography analysis, isotopic dilution can decrease the uncertainty of the measurement results from 5% to 1%. It can also be used in mass spectrometry (commonly referred to as isotopic dilution mass spectrometry or IDMS), in which the isotopic ratio can be determined with precision typically better than 0.25%.[5]
Optimum composition of the blend
In a simplified manner, the uncertainty of the measurement results is largely determined from the measurement of RAB:
From here, we obtain the relative uncertainty of nA, ur(nA) = u(nA)/nA:
The lowest relative uncertainty of nA corresponds to the condition when the first derivative with respect to RAB equals zero. In addition, it is common in mass spectrometry that u(RAB)/RAB is constant and therefore we can replace u(RAB) with RAB. These ideas combine to give
Solving this equation leads to the optimum composition of the blend AB, i.e., the geometric mean between the isotopic compositions of standard (A) and spike (B):
This simplified equation was first proposed by De Bievre and Debus numerically[4] and later by Komori et al.[6] and by Riepe and Kaiser analytically.[7] It has been noted that this simple expression is only a general approximation and it does not hold, for example, in the presence of Poisson statistics[8] or in the presence of strong isotope signal ratio correlation.[9]
Double dilution method
The single dilution method requires the knowledge of the isotopic composition of the isotopically enriched analyte (RB) and the amount of the enriched analyte added (nB). Both of these variables are hard to establish since isotopically enriched substances are generally available in small quantities of questionable purity. As a result, before isotope dilution is performed on the sample, the amount of the enriched analyte is ascertained beforehand using isotope dilution. This preparatory step is called the reverse isotope dilution and it involves a standard of natural isotopic-composition analyte (denoted as A*). First proposed in the 1940s[10] and further developed in the 1950s,[11] reverse isotope dilution remains an effective means of characterizing a labeled material.
Isotope dilution notation
Name
Symbol
Analyte
A
Natural standard
A*
Isotopic standard (Spike)
B
Analyte + Spike
AB
Standard + Spike
A*B
Reverse isotope dilution analysis of the enriched analyte:
Isotope dilution analysis of the analyte:
Since isotopic composition of A and A* are identical, combining these two expressions eliminates the need to measure the amount of the added enriched standard (nB):
Double dilution method can be designed such that the isotopic composition of the two blends, A+B and A*+B, is identical, i.e., RAB = RA*B. This condition of exact-matching double isotope dilution simplifies the above equation significantly:[12]
Triple dilution method
To avoid contamination of the mass spectrometer with the isotopically enriched spike, an additional blend of the primary standard (A*) and the spike (B) can be measured instead of measuring the enriched spike (B) directly. This approach was first put forward in the 1970s and developed in 2002.[13]
Calculations using calibration curve
Many analysts do not employ analytical equations for isotope dilution analysis. Instead, they rely on building a calibration curve from mixtures of the natural primary standard (A*) and the isotopically enriched standard (the spike, B). Calibration curves are obtained by plotting measured isotope ratios in the prepared blends against the known ratio of the sample mass to the mass of the spike solution in each blend. Isotope dilution calibration plots sometimes show nonlinear relationships and in practice polynomial fitting is often performed to empirically describe such curves.[14]
When calibration plots are markedly nonlinear, one can bypass the empirical polynomial fitting and employ the ratio of two linear functions (known as Padé approximant) which is shown to describe the curvature of isotope dilution curves exactly.[15]
↑ EPA publication SW-846, "Test Methods for Evaluating Solid Waste, Physical/Chemical Methods", available at . See Method 6800, "Elemental and Speciated Isotope Dilution Mass Spectrometry", available at .
↑ W. Riepe; W. Kaiser (1966). "Massenspektrometrische Spurenanalyse von Calcium, Strontium und Barium in Natriumazid durch Isotopenverdünnungstechnik". Anal. Bioanal. Chem.223 (5): 321–335. doi:10.1007/BF00513462. S2CID197597174.
↑ R. Hoelzl; C. Hoelzl; L. Kotz; L. Fabry (1998). "The optimal amount of isotopic spike solution for ultratrace analysis by isotope dilution mass spectrometry". Accred. Qual. Assur.3 (5): 185–188. doi:10.1007/s007690050219. S2CID98759002.
↑ Meija, Juris; Mester, Zoltan (2007). "Signal correlation in isotope ratio measurements with mass spectrometry: Effects on uncertainty propagation". Spectrochimica Acta B. 62 (11): 1278–1284. doi:10.1007/BF00513462. S2CID197597174.
This page is based on this Wikipedia article Text is available under the CC BY-SA 4.0 license; additional terms may apply. Images, videos and audio are available under their respective licenses.