Analytical technique based on determining mass to charge ratio of ions
Mass spectrometry (MS) is an analytical technique that is used to measure the mass-to-charge ratio of ions. The results are presented as a mass spectrum, a plot of intensity as a function of the mass-to-charge ratio. Mass spectrometry is used in many different fields and is applied to pure samples as well as complex mixtures.
A mass spectrum is a type of plot of the ion signal as a function of the mass-to-charge ratio. These spectra are used to determine the elemental or isotopic signature of a sample, the masses of particles and of molecules, and to elucidate the chemical identity or structure of molecules and other chemical compounds.
In a typical MS procedure, a sample, which may be solid, liquid, or gaseous, is ionized, for example by bombarding it with a beam of electrons. This may cause some of the sample's molecules to break up into positively charged fragments or simply become positively charged without fragmenting. These ions (fragments) are then separated according to their mass-to-charge ratio, for example by accelerating them and subjecting them to an electric or magnetic field: ions of the same mass-to-charge ratio will undergo the same amount of deflection.[1] The ions are detected by a mechanism capable of detecting charged particles, such as an electron multiplier. Results are displayed as spectra of the signal intensity of detected ions as a function of the mass-to-charge ratio. The atoms or molecules in the sample can be identified by correlating known masses (e.g. an entire molecule) to the identified masses or through a characteristic fragmentation pattern.
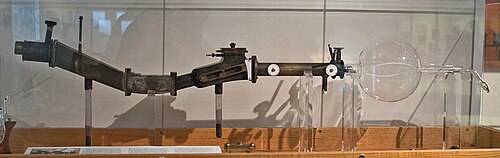
In 1886, Eugen Goldstein observed rays in gas discharges under low pressure that traveled away from the anode and through channels in a perforated cathode, opposite to the direction of negatively charged cathode rays (which travel from cathode to anode). Goldstein called these positively charged anode rays "Kanalstrahlen"; the standard translation of this term into English is "canal rays". Wilhelm Wien found that strong electric or magnetic fields deflected the canal rays and, in 1899, constructed a device with perpendicular electric and magnetic fields that separated the positive rays according to their charge-to-mass ratio (Q/m). Wien found that the charge-to-mass ratio depended on the nature of the gas in the discharge tube. English scientist J. J. Thomson later improved on the work of Wien by reducing the pressure to create the mass spectrograph.
The word spectrograph had become part of the international scientific vocabulary by 1884.[2][3] Early spectrometry devices that measured the mass-to-charge ratio of ions were called mass spectrographs which consisted of instruments that recorded a spectrum of mass values on a photographic plate.[4][5] A mass spectroscope is similar to a mass spectrograph except that the beam of ions is directed onto a phosphor screen.[6] A mass spectroscope configuration was used in early instruments when it was desired that the effects of adjustments be quickly observed. Once the instrument was properly adjusted, a photographic plate was inserted and exposed. The term mass spectroscope continued to be used even though the direct illumination of a phosphor screen was replaced by indirect measurements with an oscilloscope.[7] The use of the term mass spectroscopy is now discouraged due to the possibility of confusion with light spectroscopy.[1][8] Mass spectrometry is often abbreviated as mass-spec or simply as MS.[1]
Schematics of a simple mass spectrometer with sector type mass analyzer. This one is for the measurement of carbon dioxide isotope ratios (IRMS) as in the carbon-13urea breath test.
A mass spectrometer consists of three components: an ion source, a mass analyzer, and a detector. The ionizer converts a portion of the sample into ions. There is a wide variety of ionization techniques, depending on the phase (solid, liquid, gas) of the sample and the efficiency of various ionization mechanisms for the unknown species. An extraction system removes ions from the sample, which are then targeted through the mass analyzer and into the detector. The differences in masses of the fragments allows the mass analyzer to sort the ions by their mass-to-charge ratio. The detector measures the value of an indicator quantity and thus provides data for calculating the abundances of each ion present. Some detectors also give spatial information, e.g., a multichannel plate.
Theoretical example
The following describes the operation of a spectrometer mass analyzer, which is of the sector type. (Other analyzer types are treated below.) Consider a sample of sodium chloride (table salt). In the ion source, the sample is vaporized (turned into gas) and ionized (transformed into electrically charged particles) into sodium (Na+) and chloride (Cl−) ions.
Sodium atoms and ions are monoisotopic, with a mass of about 23 daltons (symbol: Da or older symbol: u). Chloride atoms and ions come in two stable isotopes with masses of approximately 35 u (at a natural abundance of about 75 percent) and approximately 37 u (at a natural abundance of about 25 percent).
The analyzer part of the spectrometer contains electric and magnetic fields, which exert forces on ions traveling through these fields. The speed of a charged particle may be increased or decreased while passing through the electric field, and its direction may be altered by the magnetic field.
The magnitude of the deflection of the moving ion's trajectory depends on its mass-to-charge ratio. Lighter ions are deflected by the magnetic force to a greater degree than heavier ions (based on Newton's second law of motion, F = ma).
The streams of magnetically sorted ions pass from the analyzer to the detector, which records the relative abundance of each ion type. This information is used to determine the chemical element composition of the original sample (i.e. that both sodium and chlorine are present in the sample) and the isotopic composition of its constituents (the ratio of 35Cl to 37Cl).
The ion source is the part of the mass spectrometer that ionizes the material under analysis (the analyte). Techniques for ionization have been key to determining what types of samples can be analyzed by mass spectrometry. Electron ionization and chemical ionization are used for gases and vapors.
In chemical ionization sources, the analyte is ionized by chemical ion-molecule reactions during collisions in the source. Two techniques often used with liquid and solid biological samples include electrospray ionization (invented by John Fenn[11]) and matrix-assisted laser desorption/ionization (MALDI, initially developed as a similar technique "Soft Laser Desorption (SLD)" by K. Tanaka[12] for which a Nobel Prize was awarded and as MALDI by M. Karas and F. Hillenkamp[13]).
Hard ionization and soft ionization
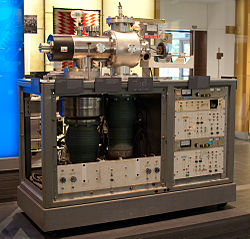
Quadrupole mass spectrometer and electrospray ion source used for Fenn's early work
In mass spectrometry, ionization refers to the production of gas phase ions suitable for resolution in the mass analyser or mass filter. Ionization occurs in the ion source. There are several ion sources available; each has advantages and disadvantages for particular applications. For example, electron ionization (EI) gives a high degree of fragmentation, yielding highly detailed mass spectra which when skilfully analysed can provide important information for structural elucidation/characterisation and facilitate identification of unknown compounds by comparison to mass spectral libraries obtained under identical operating conditions. However, EI is not suitable for coupling to HPLC, i.e. LC-MS, since at atmospheric pressure, the filaments used to generate electrons burn out rapidly. Thus EI is coupled predominantly with GC, i.e. GC-MS, where the entire system is under high vacuum.
Hard ionization techniques are processes which impart high quantities of residual energy in the subject molecule invoking large degrees of fragmentation (i.e. the systematic rupturing of bonds acts to remove the excess energy, restoring stability to the resulting ion). Resultant ions tend to have m/z lower than the molecular ion (other than in the case of proton transfer and not including isotope peaks). The most common example of hard ionization is electron ionization (EI).
Inductively coupled plasma (ICP) sources are used primarily for cation analysis of a wide array of sample types. In this source, a plasma that is electrically neutral overall, but that has had a substantial fraction of its atoms ionized by high temperature, is used to atomize introduced sample molecules and to further strip the outer electrons from those atoms. The plasma is usually generated from argon gas, since the first ionization energy of argon atoms is higher than the first of any other elements except He, F and Ne, but lower than the second ionization energy of all except the most electropositive metals. The heating is achieved by a radio-frequency current passed through a coil surrounding the plasma.
Photoionization mass spectrometry
Photoionization can be used in experiments which seek to use mass spectrometry as a means of resolving chemical kinetics mechanisms and isomeric product branching.[14] In such instances a high energy photon, either X-ray or uv, is used to dissociate stable gaseous molecules in a carrier gas of He or Ar. In instances where a synchrotron light source is utilized, a tuneable photon energy can be utilized to acquire a photoionization efficiency curve which can be used in conjunction with the charge ratio m/z to fingerprint molecular and ionic species. More recently atmospheric pressure photoionization (APPI) has been developed to ionize molecules mostly as effluents of LC-MS systems.
Ambient ionization
Some applications for ambient ionization include environmental applications as well as clinical applications. In these techniques, ions form in an ion source outside the mass spectrometer. Sampling becomes easy as the samples don't need previous separation nor preparation. Some examples of ambient ionization techniques are Direct Analysis in Real Time (DART),DESI, SESI, LAESI, desorption atmospheric-pressure chemical ionization (DAPCI), Soft Ionization by Chemical Reaction in Transfer (SICRT) and desorption atmospheric pressure photoionization DAPPI among others.
Mass analyzers separate the ions according to their mass-to-charge ratio. The following two laws govern the dynamics of charged particles in electric and magnetic fields in vacuum:
(Newton's second law of motion in the non-relativistic case, i.e. valid only at ion velocity much lower than the speed of light).
Here F is the force applied to the ion, m is the mass of the ion, a is the acceleration, Q is the ion charge, E is the electric field, and v × B is the vector cross product of the ion velocity and the magnetic field
Equating the above expressions for the force applied to the ion yields:
This differential equationis the classic equation of motion for charged particles. Together with the particle's initial conditions, it completely determines the particle's motion in space and time in terms of m/Q. Thus mass spectrometers could be thought of as "mass-to-charge spectrometers". When presenting data, it is common to use the (officially) dimensionlessm/z, where z is the number of elementary charges (e) on the ion (z=Q/e). This quantity, although it is informally called the mass-to-charge ratio, more accurately speaking represents the ratio of the mass number and the charge number, z.
There are many types of mass analyzers, using either static or dynamic fields, and magnetic or electric fields, but all operate according to the above differential equation. Each analyzer type has its strengths and weaknesses. Many mass spectrometers use two or more mass analyzers for tandem mass spectrometry (MS/MS). In addition to the more common mass analyzers listed below, there are others designed for special situations.
There are several important analyzer characteristics. The mass resolving power is the measure of the ability to distinguish two peaks of slightly different m/z. The mass accuracy is the ratio of the m/z measurement error to the true m/z. Mass accuracy is usually measured in ppm or milli mass units. The mass range is the range of m/z amenable to analysis by a given analyzer. The linear dynamic range is the range over which ion signal is linear with analyte concentration. Speed refers to the time frame of the experiment and ultimately is used to determine the number of spectra per unit time that can be generated.
A sector field mass analyzer uses a static electric and/or magnetic field to affect the path and/or velocity of the charged particles in some way. As shown above, sector instruments bend the trajectories of the ions as they pass through the mass analyzer, according to their mass-to-charge ratios, deflecting the more charged and faster-moving, lighter ions more. The analyzer can be used to select a narrow range of m/z or to scan through a range of m/z to catalog the ions present.[16]
The time-of-flight (TOF) analyzer uses an electric field to accelerate the ions through the same potential, and then measures the time they take to reach the detector. If the particles all have the same charge, their kinetic energies will be identical, and their velocities will depend only on their masses. For example, ions with a lower mass will travel faster, reaching the detector first.[17] Ions usually are moving prior to being accelerated by the electric field, this causes particles with the same m/z to arrive at different times at the detector. This difference in initial velocities is often not dependent on the mass of the ion, and will turn into a difference in the final velocity. This distribution in velocities broadens the peaks shown on the count vs m/z plot, but will generally not change the central location of the peaks, since the starting velocity of ions is generally centered at zero. To fix this problem, time-lag focusing/delayed extraction has been coupled with TOF-MS.[18]
Quadrupole mass analyzers use oscillating electrical fields to selectively stabilize or destabilize the paths of ions passing through a radio frequency (RF) quadrupole field created between four parallel rods. Only the ions in a certain range of mass/charge ratio are passed through the system at any time, but changes to the potentials on the rods allow a wide range of m/z values to be swept rapidly, either continuously or in a succession of discrete hops. A quadrupole mass analyzer acts as a mass-selective filter and is closely related to the quadrupole ion trap, particularly the linear quadrupole ion trap except that it is designed to pass the untrapped ions rather than collect the trapped ones, and is for that reason referred to as a transmission quadrupole. A magnetically enhanced quadrupole mass analyzer includes the addition of a magnetic field, either applied axially or transversely. This novel type of instrument leads to an additional performance enhancement in terms of resolution and/or sensitivity depending upon the magnitude and orientation of the applied magnetic field.[19][20] A common variation of the transmission quadrupole is the triple quadrupole mass spectrometer. The "triple quad" has three consecutive quadrupole stages, the first acting as a mass filter to transmit a particular incoming ion to the second quadrupole, a collision chamber, wherein that ion can be broken into fragments. The third quadrupole also acts as a mass filter, to transmit a particular fragment ion to the detector. If a quadrupole is made to rapidly and repetitively cycle through a range of mass filter settings, full spectra can be reported. Likewise, a triple quad can be made to perform various scan types characteristic of tandem mass spectrometry.
The quadrupole ion trap works on the same physical principles as the quadrupole mass analyzer, but the ions are trapped and sequentially ejected. Ions are trapped in a mainly quadrupole RF field, in a space defined by a ring electrode (usually connected to the main RF potential) between two endcap electrodes (typically connected to DC or auxiliary AC potentials). The sample is ionized either internally (e.g. with an electron or laser beam), or externally, in which case the ions are often introduced through an aperture in an endcap electrode.
There are many mass/charge separation and isolation methods but the most commonly used is the mass instability mode in which the RF potential is ramped so that the orbit of ions with a mass a>b are stable while ions with mass b become unstable and are ejected on the z-axis onto a detector. There are also non-destructive analysis methods.
Ions may also be ejected by the resonance excitation method, whereby a supplemental oscillatory excitation voltage is applied to the endcap electrodes, and the trapping voltage amplitude and/or excitation voltage frequency is varied to bring ions into a resonance condition in order of their mass/charge ratio.[21][22]
Cylindrical ion trap
The cylindrical ion trap mass spectrometer (CIT) is a derivative of the quadrupole ion trap where the electrodes are formed from flat rings rather than hyperbolic shaped electrodes. The architecture lends itself well to miniaturization because as the size of a trap is reduced, the shape of the electric field near the center of the trap, the region where the ions are trapped, forms a shape similar to that of a hyperbolic trap.
Linear quadrupole ion trap
A linear quadrupole ion trap is similar to a quadrupole ion trap, but it traps ions in a two dimensional quadrupole field, instead of a three-dimensional quadrupole field as in a 3D quadrupole ion trap. Thermo Fisher's LTQ ("linear trap quadrupole") is an example of the linear ion trap.[23]
A toroidal ion trap can be visualized as a linear quadrupole curved around and connected at the ends or as a cross-section of a 3D ion trap rotated on edge to form the toroid, donut-shaped trap. The trap can store large volumes of ions by distributing them throughout the ring-like trap structure. This toroidal shaped trap is a configuration that allows the increased miniaturization of an ion trap mass analyzer. Additionally, all ions are stored in the same trapping field and ejected together simplifying detection that can be complicated with array configurations due to variations in detector alignment and machining of the arrays.[24]
As with the toroidal trap, linear traps and 3D quadrupole ion traps are the most commonly miniaturized mass analyzers due to their high sensitivity, tolerance for mTorr pressure, and capabilities for single analyzer tandem mass spectrometry (e.g. product ion scans).[25]
Orbitrap instruments are similar to Fourier-transform ion cyclotron resonance mass spectrometers (see text below). Ions are electrostatically trapped in an orbit around a central, spindle shaped electrode. The electrode confines the ions so that they both orbit around the central electrode and oscillate back and forth along the central electrode's long axis. This oscillation generates an image current in the detector plates which is recorded by the instrument. The frequencies of these image currents depend on the mass-to-charge ratios of the ions. Mass spectra are obtained by Fourier transformation of the recorded image currents.
Orbitraps have a high mass accuracy, high sensitivity and a good dynamic range.[26]
Fourier-transform ion cyclotron resonance
Fourier-transform ion cyclotron resonance mass spectrometer
Fourier-transform mass spectrometry (FTMS), or more precisely Fourier-transform ion cyclotron resonance MS, measures mass by detecting the image current produced by ions cyclotroning in the presence of a magnetic field. Instead of measuring the deflection of ions with a detector such as an electron multiplier, the ions are injected into a Penning trap (a static electric/magnetic ion trap) where they effectively form part of a circuit. Detectors at fixed positions in space measure the electrical signal of ions which pass near them over time, producing a periodic signal. Since the frequency of an ion's cycling is determined by its mass-to-charge ratio, this can be deconvoluted by performing a Fourier transform on the signal. FTMS has the advantage of high sensitivity (since each ion is "counted" more than once) and much higher resolution and thus precision.[27][28]
Ion cyclotron resonance (ICR) is an older mass analysis technique similar to FTMS except that ions are detected with a traditional detector. Ions trapped in a Penning trap are excited by an RF electric field until they impact the wall of the trap, where the detector is located. Ions of different mass are resolved according to impact time.
Detectors
A continuous dynode particle multiplier detector
The final element of the mass spectrometer is the detector. The detector records either the charge induced or the current produced when an ion passes by or hits a surface. In a scanning instrument, the signal produced in the detector during the course of the scan versus where the instrument is in the scan (at what m/Q) will produce a mass spectrum, a record of ions as a function of m/Q.
Typically, some type of electron multiplier is used, though other detectors including Faraday cups and ion-to-photon detectors are also used. Because the number of ions leaving the mass analyzer at a particular instant is typically quite small, considerable amplification is often necessary to get a signal. Microchannel plate detectors are commonly used in modern commercial instruments.[29] In FTMS and Orbitraps, the detector consists of a pair of metal surfaces within the mass analyzer/ion trap region which the ions only pass near as they oscillate. No direct current is produced, only a weak AC image current is produced in a circuit between the electrodes. Other inductive detectors have also been used.[30]
Tandem mass spectrometry
Tandem mass spectrometry for biological molecules using ESI or MALDI
Tandem mass spectrometry enables a variety of experimental sequences. Many commercial mass spectrometers are designed to expedite the execution of such routine sequences as selected reaction monitoring (SRM), precursor ion scanning, product ion scanning, and neutral loss scanning.[32]
In SRM, the first analyzer allows only a single mass through and the second analyzer monitors for multiple user-defined fragment ions over longer dwell-times than could be achieved in a full scan. This increases sensitivity.
In product ion scans, the first mass analyzer is fixed to select a particular precursor ion ("parent"), while the second is scanned to find all the fragments ("products", or "daughter ions") to which it can be fragmented in the collision cell.
In precursor ion scans, the second mass analyzer is fixed to select a particular fragment ion ("daughter"), while the first is scanned to find all possible precursor ions that could give rise to this fragment.
In neutral loss scans, the two mass analyzers are scanned in parallel, but separated by the mass of a molecular subunit of interest to the analyst. Ions are detected if they lose that fixed mass during fragmentation. This can be used to look for any chemical that is capable of losing a particular neutral group, for example a sugar residue. Together, neutral loss and precursor ion scans can be used to hunt for chemicals with particular motifs.
Another type of tandem mass spectrometry used for radiocarbon dating is accelerator mass spectrometry (AMS), which uses very high voltages, usually in the mega-volt range, to accelerate negative ions into a type of tandem mass spectrometer.
The METLIN Metabolite and Chemical Entity Database[33][34][35][36][37] is the largest repository of experimental tandem mass spectrometry data acquired from standards. The tandem mass spectrometry data on over 960,000 molecular standards (as of October 2025)[33][36] is provided to facilitate the identification of chemical entities from tandem mass spectrometry experiments.[38] In addition to the identification of known molecules it is also useful for identifying unknowns using its similarity searching/analysis.[39] All tandem mass spectrometry data comes from the experimental analysis of standards at multiple collision energies and in both positive and negative ionization modes.[33]
Common mass spectrometer configurations and techniques
Certain applications of mass spectrometry have developed monikers that although strictly speaking would seem to refer to a broad application, in practice have come instead to connote a specific or a limited number of instrument configurations. An example of this is isotope-ratio mass spectrometry (IRMS), which refers in practice to the use of a limited number of sector based mass analyzers; this name is used to refer to both the application and the instrument used for the application.
Separation techniques combined with mass spectrometry
An important enhancement to the mass resolving and mass determining capabilities of mass spectrometry is using it in tandem with chromatographic and other separation techniques.
Gas chromatography
A gas chromatograph (right) directly coupled to a mass spectrometer (left)
A common combination is gas chromatography-mass spectrometry (GC/MS or GC-MS). In this technique, a gas chromatograph is used to separate different compounds. This stream of separated compounds is fed online into the ion source, a metallicfilament to which voltage is applied. This filament emits electrons which ionize the compounds. The ions can then further fragment, yielding predictable patterns. Intact ions and fragments pass into the mass spectrometer's analyzer and are eventually detected.[40] However, the high temperatures (300°C) used in the GC-MS injection port (and oven) can result in thermal degradation of injected molecules, thus resulting in the measurement of degradation products instead of the actual molecule(s) of interest.[41]
Similarly to gas chromatography MS (GC-MS), liquid chromatography-mass spectrometry (LC/MS or LC-MS) separates compounds chromatographically before they are introduced to the ion source and mass spectrometer. It differs from GC-MS in that the mobile phase is liquid, usually a mixture of water and organic solvents, instead of gas. Most commonly, an electrospray ionization source is used in LC-MS. Other popular and commercially available LC-MS ion sources are atmospheric pressure chemical ionization and atmospheric pressure photoionization. There are also some newly developed ionization techniques like laser spray.
Capillary electrophoresis–mass spectrometry (CE-MS) is a technique that combines the liquid separation process of capillary electrophoresis with mass spectrometry.[42] CE-MS is typically coupled to electrospray ionization.[43]
Ion mobility spectrometry-mass spectrometry (IMS/MS or IMMS) is a technique where ions are first separated by drift time through some neutral gas under an applied electrical potential gradient before being introduced into a mass spectrometer.[44] Drift time is a measure of the collisional cross section relative to the charge of the ion. The duty cycle of IMS (the time over which the experiment takes place) is longer than most mass spectrometric techniques, such that the mass spectrometer can sample along the course of the IMS separation. This produces data about the IMS separation and the mass-to-charge ratio of the ions in a manner similar to LC-MS.[45]
The duty cycle of IMS is short relative to liquid chromatography or gas chromatography separations and can thus be coupled to such techniques, producing triple modalities such as LC/IMS/MS.[46]
Data and analysis
Mass spectrum of a peptide showing the isotopic distribution
Other types of mass spectrometry data are well represented as a three-dimensional contour map. In this form, the mass-to-charge, m/z is on the x-axis, intensity the y-axis, and an additional experimental parameter, such as time, is recorded on the z-axis.
Data analysis
Mass spectrometry data analysis is specific to the type of experiment producing the data. General subdivisions of data are fundamental to understanding any data.
Many mass spectrometers work in either negative ion mode or positive ion mode. It is very important to know whether the observed ions are negatively or positively charged. This is often important in determining the neutral mass but it also indicates something about the nature of the molecules.
Different types of ion source result in different arrays of fragments produced from the original molecules. An electron ionization source produces many fragments and mostly single-charged (1-) radicals (odd number of electrons), whereas an electrospray source usually produces non-radical quasimolecular ions that are frequently multiply charged. Tandem mass spectrometry purposely produces fragment ions post-source and can drastically change the sort of data achieved by an experiment.
Knowledge of the origin of a sample can provide insight into the component molecules of the sample and their fragmentations. A sample from a synthesis/manufacturing process will probably contain impurities chemically related to the target component. A crudely prepared biological sample will probably contain a certain amount of salt, which may form adducts with the analyte molecules in certain analyses.
Results can also depend heavily on sample preparation and how it was run/introduced. An important example is the issue of which matrix is used for MALDI spotting, since much of the energetics of the desorption/ionization event is controlled by the matrix rather than the laser power. Sometimes samples are spiked with sodium or another ion-carrying species to produce adducts rather than a protonated species.
Mass spectrometry can measure molar mass, molecular structure, and sample purity. Each of these questions requires a different experimental procedure; therefore, adequate definition of the experimental goal is a prerequisite for collecting the proper data and successfully interpreting it.
Since the precise structure or peptide sequence of a molecule is deciphered through the set of fragment masses, the interpretation of mass spectra requires combined use of various techniques. Usually the first strategy for identifying an unknown compound is to compare its experimental mass spectrum against a library of mass spectra. If no matches result from the search, then manual interpretation[47] or software assisted interpretation of mass spectra must be performed. Computer simulation of ionization and fragmentation processes occurring in mass spectrometer is the primary tool for assigning structure or peptide sequence to a molecule. An a priori structural information is fragmented in silico and the resulting pattern is compared with observed spectrum. Such simulation is often supported by a fragmentation library[48] that contains published patterns of known decomposition reactions. Software taking advantage of this idea has been developed for both small molecules and proteins.
Analysis of mass spectra can also be spectra with accurate mass. A mass-to-charge ratio value (m/z) with only integer precision can represent an immense number of theoretically possible ion structures; however, more precise mass figures significantly reduce the number of candidate molecular formulas. A computer algorithm called formula generator calculates all molecular formulas that theoretically fit a given mass with specified tolerance.
A recent technique for structure elucidation in mass spectrometry, called precursor ion fingerprinting, identifies individual pieces of structural information by conducting a search of the tandem spectra of the molecule under investigation against a library of the product-ion spectra of structurally characterized precursor ions.[49]
Mass spectrometry has both qualitative and quantitative uses. These include identifying unknown compounds, determining the isotopic composition of elements in a molecule, and determining the structure of a compound by observing its fragmentation. Other uses include quantifying the amount of a compound in a sample or studying the fundamentals of gas phase ion chemistry (the chemistry of ions and neutrals in a vacuum). MS is now commonly used in analytical laboratories that study physical, chemical, or biological properties of a great variety of compounds. Quantification can be relative (analyzed relative to a reference sample) or absolute (analyzed using a standard curve method).[50]
As an analytical technique it possesses distinct advantages such as: Increased sensitivity over most other analytical techniques because the analyzer, as a mass-charge filter, reduces background interference, Excellent specificity from characteristic fragmentation patterns to identify unknowns or confirm the presence of suspected compounds, Information about molecular weight, Information about the isotopic abundance of elements, Temporally resolved chemical data.
A few of the disadvantages of the method is that it often fails to distinguish between optical and geometrical isomers and the positions of substituent in o-, m- and p- positions in an aromatic ring. Also, its scope is limited in identifying hydrocarbons that produce similar fragmented ions.
Isotope ratio MS: isotope dating and tracing
Mass spectrometer to determine the O/ O and C/ C isotope ratio on biogenous carbonate
Mass spectrometry is also used to determine the isotopic composition of elements within a sample. Differences in mass among isotopes of an element are very small, and the less abundant isotopes of an element are typically very rare, so a very sensitive instrument is required. These instruments, sometimes referred to as isotope ratio mass spectrometers (IR-MS), usually use a single magnet to bend a beam of ionized particles towards a series of Faraday cups which convert particle impacts to electric current. A fast on-line analysis of deuterium content of water can be done using flowing afterglow mass spectrometry, FA-MS. Probably the most sensitive and accurate mass spectrometer for this purpose is the accelerator mass spectrometer (AMS). This is because it provides ultimate sensitivity, capable of measuring individual atoms and measuring nuclides with a dynamic range of ~1015 relative to the major stable isotope.[51] Isotope ratios are important markers of a variety of processes. Some isotope ratios are used to determine the age of materials for example as in carbon dating. Labeling with stable isotopes is also used for protein quantification. (see protein characterization below)
Membrane-introduction mass spectrometry: measuring gases in solution
Membrane-introduction mass spectrometry combines the isotope ratio MS with a reaction chamber/cell separated by a gas-permeable membrane. This method allows the study of gases as they evolve in solution. This method has been extensively used for the study of the production of oxygen by Photosystem II.[52]
Trace gas analysis
Several techniques use ions created in a dedicated ion source injected into a flow tube or a drift tube: selected ion flow tube (SIFT-MS), and proton transfer reaction (PTR-MS), are variants of chemical ionization dedicated for trace gas analysis of air, breath or liquid headspace using well defined reaction time allowing calculations of analyte concentrations from the known reaction kinetics without the need for internal standard or calibration.
Another technique with applications in trace gas analysis field is secondary electrospray ionization (SESI-MS), which is a variant of electrospray ionization. SESI consist of an electrospray plume of pure acidified solvent that interacts with neutral vapors. Vapor molecules get ionized at atmospheric pressure when charge is transferred from the ions formed in the electrospray to the molecules. One advantage of this approach is that it is compatible with most ESI-MS systems.[53][54]
Residual gas analyzer installed on a laboratory-scale freeze dryer
A residual gas analyzer (RGA) is a small and usually rugged mass spectrometer, typically designed for process control and contamination monitoring in vacuum systems. When constructed as a quadrupole mass analyzer, there exist two implementations, utilizing either an open ion source (OIS) or a closed ion source (CIS). RGAs may be found in high vacuum applications such as research chambers, surface science setups, accelerators, scanning microscopes, etc. RGAs are used in most cases to monitor the quality of the vacuum and easily detect minute traces of impurities in the low-pressure gas environment. These impurities can be measured down to Torr levels, possessing sub-ppm detectability in the absence of background interferences.
RGAs would also be used as sensitive in-situ leak detectors commonly using helium, isopropyl alcohol or other tracer molecules. With vacuum systems pumped down to lower than Torr—checking of the integrity of the vacuum seals and the quality of the vacuum—air leaks, virtual leaks and other contaminants at low levels may be detected before a process is initiated.
Atom probe
An atom probe is an instrument that combines time-of-flight mass spectrometry and field-evaporation microscopy to map the location of individual atoms.
Pharmacokinetics is often studied using mass spectrometry because of the complex nature of the matrix (often blood or urine) and the need for high sensitivity to observe low dose and long time point data. The most common instrumentation used in this application is LC-MS with a triple quadrupole mass spectrometer. Tandem mass spectrometry is usually employed for added specificity. Standard curves and internal standards are used for quantitation of usually a single pharmaceutical in the samples. The samples represent different time points as a pharmaceutical is administered and then metabolized or cleared from the body. Blank or t=0 samples taken before administration are important in determining background and ensuring data integrity with such complex sample matrices. Much attention is paid to the linearity of the standard curve; however it is not uncommon to use curve fitting with more complex functions such as quadratics since the response of most mass spectrometers is less than linear across large concentration ranges.[55][56][57]
There is currently considerable interest in the use of very high sensitivity mass spectrometry for microdosing studies, which are seen as a promising alternative to animal experimentation.
Recent studies show that secondary electrospray ionization (SESI) is a powerful technique to monitor drug kinetics via breath analysis.[58][59] Because breath is naturally produced, several datapoints can be readily collected. This allows for the number of collected data-points to be greatly increased.[60] In animal studies, this approach SESI can reduce animal sacrifice.[59] In humans, SESI-MS non-invasive analysis of breath can help study the kinetics of drugs at a personalized level.[58][61][62]
Mass spectrometry is an important method for the characterization and sequencing of proteins. The two primary methods for ionization of whole proteins are electrospray ionization (ESI) and matrix-assisted laser desorption/ionization (MALDI). In keeping with the performance and mass range of available mass spectrometers, two approaches are used for characterizing proteins. In the first, intact proteins are ionized by either of the two techniques described above, and then introduced to a mass analyzer. This approach is referred to as "top-down" strategy of protein analysis. The top-down approach however is largely limited to low-throughput single-protein studies. In the second, proteins are enzymatically digested into smaller peptides using proteases such as trypsin or pepsin, either in solution or in gel after electrophoretic separation. Other proteolytic agents are also used. The collection of peptide products are often separated by chromatography prior to introduction to the mass analyzer. When the characteristic pattern of peptides is used for the identification of the protein the method is called peptide mass fingerprinting (PMF), if the identification is performed using the sequence data determined in tandem MS analysis it is called de novo peptide sequencing. These procedures of protein analysis are also referred to as the "bottom-up" approach, and have also been used to analyse the distribution and position of post-translational modifications such as phosphorylation on proteins.[63] A third approach is also beginning to be used, this intermediate "middle-down" approach involves analyzing proteolytic peptides that are larger than the typical tryptic peptide.[64]
Space exploration
NASA's Phoenix Mars Lander analyzing a soil sample from the "Rosy Red" trench with the TEGA mass spectrometer
As a standard method for analysis, mass spectrometers have reached other planets and moons. Two were taken to Mars by the Viking program. In early 2005 the Cassini–Huygens mission delivered a specialized GC-MS instrument aboard the Huygens probe through the atmosphere of Titan, the largest moon of the planet Saturn. This instrument analyzed atmospheric samples along its descent trajectory and was able to vaporize and analyze samples of Titan's frozen, hydrocarbon covered surface once the probe had landed. These measurements compare the abundance of isotope(s) of each particle comparatively to earth's natural abundance.[65] Also on board the Cassini–Huygens spacecraft was an ion and neutral mass spectrometer which had been taking measurements of Titan's atmospheric composition as well as the composition of Enceladus' plumes. A Thermal and Evolved Gas Analyzer mass spectrometer was carried by the Mars Phoenix Lander launched in 2007.[66]
Mass spectrometers are also widely used in space missions to measure the composition of plasmas. For example, the Cassini spacecraft carried the Cassini Plasma Spectrometer (CAPS),[67] which measured the mass of ions in Saturn's magnetosphere.
Respired gas monitor
Mass spectrometers were used in hospitals for respiratory gas analysis beginning around 1975 through the end of the century. Some are probably still in use but none are currently being manufactured.[68]
Found mostly in the operating room, they were a part of a complex system, in which respired gas samples from patients undergoing anesthesia were drawn into the instrument through a valve mechanism designed to sequentially connect up to 32 rooms to the mass spectrometer. A computer directed all operations of the system. The data collected from the mass spectrometer was delivered to the individual rooms for the anesthesiologist to use.
The uniqueness of this magnetic sector mass spectrometer may have been the fact that a plane of detectors, each purposely positioned to collect all of the ion species expected to be in the samples, allowed the instrument to simultaneously report all of the gases respired by the patient. Although the mass range was limited to slightly over 120 u, fragmentation of some of the heavier molecules negated the need for a higher detection limit.[69]
Preparative mass spectrometry
The primary function of mass spectrometry is as a tool for chemical analyses based on detection and quantification of ions according to their mass-to-charge ratio. However, mass spectrometry also shows promise for material synthesis.[51] Ion soft landing is characterized by deposition of intact species on surfaces at low kinetic energies which precludes the fragmentation of the incident species.[70] The soft landing technique was first reported in 1977 for the reaction of low energy sulfur containing ions on a lead surface.[71]
Charge detection mass spectrometry
Most mass spectrometers measure the mass-to-charge ratio; the actual mass can be found only if the charge is known. For smaller molecules the charge can be determined from the spacing of isotope peaks, but for very large biomolecules and particles (in the megadalton range) resolution may not be adequate to separate isotope peaks, and thus the mass cannot be determined. In charge detection mass spectrometry (CDMS), the charge of an individual ion/particle is measured directly (alongside its mass-to-charge ratio) and therefore the true mass is known. It is a single-particle technique, but to produce more precise and accurate results, the data from many individually-measured ions can be combined.[72][73]
↑Downard KM (2007). "Historical account: Francis William Aston: the man behind the mass spectrograph". European Journal of Mass Spectrometry. 13 (3): 177–90. doi:10.1255/ejms.878. PMID17881785. S2CID25747367.
↑Price P (August 1991). "Standard definitions of terms relating to mass spectrometry: A report from the committee on measurements and standards of the American society for mass spectrometry". Journal of the American Society for Mass Spectrometry. 2 (4): 336–48. Bibcode:1991JASMS...2..336P. doi:10.1016/1044-0305(91)80025-3. PMID24242353. S2CID20236081.
↑If the ions do not start at identical kinetic energies, then some ions may lag behind higher kinetic energy ions decreasing resolution. Reflectron geometries are commonly employed to correct this problem. Wollnik, H. (1993). "Time-of-flight mass analyzers". Mass Spectrometry Reviews. 12 (2): 89–114. Bibcode:1993MSRv...12...89W. doi:10.1002/mas.1280120202.
↑Maher S, Syed SU, Hughes DM, Gibson JR, Taylor S (August 2013). "Mapping the stability diagram of a quadrupole mass spectrometer with a static transverse magnetic field applied". Journal of the American Society for Mass Spectrometry. 24 (8): 1307–14. Bibcode:2013JASMS..24.1307M. doi:10.1007/s13361-013-0654-5. PMID23720050. S2CID45734248.
↑Lammert SA, Rockwood AA, Wang M, Lee ML, Lee ED, Tolley SE, Oliphant JR, Jones JL, Waite RW (July 2006). "Miniature toroidal radio frequency ion trap mass analyzer". Journal of the American Society for Mass Spectrometry. 17 (7): 916–922. Bibcode:2006JASMS..17..916L. doi:10.1016/j.jasms.2006.02.009. PMID16697659. S2CID45444397.
↑Eiceman, G.A. (2000). Gas Chromatography. In R.A. Meyers (Ed.), Encyclopedia of Analytical Chemistry: Applications, Theory, and Instrumentation, pp. 10627. Chichester: Wiley. ISBN0-471-97670-9
↑Li X, Huang L, Zhu H, Zhou Z (February 2017). "Direct human breath analysis by secondary nano-electrospray ionization ultrahigh-resolution mass spectrometry: Importance of high mass resolution and mass accuracy". Rapid Communications in Mass Spectrometry. 31 (3): 301–308. Bibcode:2017RCMS...31..301L. doi:10.1002/rcm.7794. PMID27859758.
↑Hsieh Y, Korfmacher WA (June 2006). "Increasing speed and throughput when using HPLC-MS/MS systems for drug metabolism and pharmacokinetic screening". Current Drug Metabolism. 7 (5): 479–89. doi:10.2174/138920006777697963. PMID16787157. S2CID13612670.
↑Covey TR, Lee ED, Henion JD (October 1986). "High-speed liquid chromatography/tandem mass spectrometry for the determination of drugs in biological samples". Analytical Chemistry. 58 (12): 2453–60. Bibcode:1986AnaCh..58.2453C. doi:10.1021/ac00125a022. PMID3789400.
↑Covey TR, Crowther JB, Dewey EA, Henion JD (February 1985). "Thermospray liquid chromatography/mass spectrometry determination of drugs and their metabolites in biological fluids". Analytical Chemistry. 57 (2): 474–81. Bibcode:1985AnaCh..57..474C. doi:10.1021/ac50001a036. PMID3977076.
Sobott F (2014). Biological Mass Spectrometry. Boca Raton: Crc Pr I Llc. ISBN978-1-4398-9527-6.
Sparkman OD (2006). Mass Spectrometry Desk Reference. Pittsburgh: Global View Pub. ISBN978-0-9660813-9-8.
Watson JT, Sparkman OD (2007). Introduction to Mass Spectrometry: Instrumentatio, Applications, and Strategies for Data Interpretation (4thed.). Chichester: Jonh Wiley & Sons. ISBN978-0-470-51634-8.
Kandiah M, Urban PL (June 2013). "Advances in ultrasensitive mass spectrometry of organic molecules". Chemical Society Reviews. 42 (12): 5299–322. doi:10.1039/c3cs35389c. PMID23471277.
Calmes J (2011). Mass spec: the biography of a scientific instrument (MS). Massachusetts Instite of Technology. hdl:1721.1/68473.
This page is based on this Wikipedia article Text is available under the CC BY-SA 4.0 license; additional terms may apply. Images, videos and audio are available under their respective licenses.