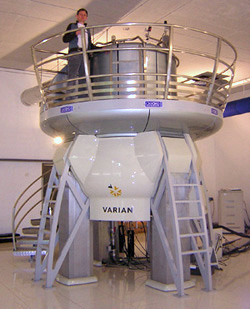
A 900MHz NMR instrument with a 21.1T magnet at HWB-NMR, Birmingham, UK
Nuclear magnetic resonance spectroscopy, most commonly known as NMR spectroscopy or magnetic resonance spectroscopy (MRS), is a spectroscopic technique based on re-orientation of atomic nuclei with non-zero nuclear spins in an external magnetic field. This re-orientation occurs with absorption of electromagnetic radiation in the radio frequency region from roughly 4 to 900MHz, which depends on the isotopic nature of the nucleus and increases proportionally to the strength of the external magnetic field.[1] Notably, the resonance frequency of each NMR-active nucleus depends on its chemical environment. As a result, NMR spectra provide information about individual functional groups present in the sample, as well as about connections between nearby nuclei in the same molecule. As the NMR spectra are unique or highly characteristic to individual compounds and functional groups, NMR spectroscopy is one of the most important methods to identify molecular structures, particularly of organic compounds.
The principle of NMR usually involves three sequential steps:
The alignment (polarization) of the magnetic nuclear spins in an applied, constant magnetic field B0.
The perturbation of this alignment of the nuclear spins by a weak oscillating magnetic field, usually referred to as a radio-frequency (RF) pulse.
Detection and analysis of the electromagnetic waves emitted by the nuclei of the sample as a result of this perturbation.
Similarly, biochemists use NMR to identify proteins and other complex molecules. Besides identification, NMR spectroscopy provides detailed information about the structure, dynamics, reaction state, and chemical environment of molecules. The most common types of NMR are proton and carbon-13 NMR spectroscopy, but it is applicable to any kind of sample that contains nuclei possessing spin.
NMR spectra are unique, well-resolved, analytically tractable and often highly predictable for small molecules. Different functional groups are obviously distinguishable, and identical functional groups with differing neighboring substituents still give distinguishable signals. NMR has largely replaced traditional wet chemistry tests such as color reagents or typical chromatography for identification.
The most significant drawback of NMR spectroscopy is its poor sensitivity (compared to other analytical methods, such as mass spectrometry). Typically 2–50mg of a substance is required to record a decent-quality NMR spectrum. The NMR method is non-destructive, thus the substance may be recovered. To obtain high-resolution NMR spectra, solid substances are usually dissolved to make liquid solutions, although solid-state NMR spectroscopy is also possible.
The timescale of NMR is relatively long, and thus it is not suitable for observing fast phenomena, producing only an averaged spectrum. Although large amounts of impurities do show on an NMR spectrum, better methods exist for detecting impurities, as NMR is inherently not very sensitive– though at higher frequencies, sensitivity is higher.
Correlation spectroscopy is a development of ordinary NMR. In two-dimensional NMR, the emission is centered around a single frequency, and correlated resonances are observed. This allows identifying the neighboring substituents of the observed functional group, allowing unambiguous identification of the resonances. There are also more complex 3D and 4D methods and a variety of methods designed to suppress or amplify particular types of resonances. In nuclear Overhauser effect (NOE) spectroscopy, the relaxation of the resonances is observed. As NOE depends on the proximity of the nuclei, quantifying the NOE for each nucleus allows construction of a three-dimensional model of the molecule.
Cutaway of an NMR magnet that shows its structure: radiation shield, vacuum chamber, liquid-nitrogen vessel, liquid-helium vessel, and cryogenic shims.
NMR spectrometers are relatively expensive; universities usually have them, but they are less common in private companies. Between 2000 and 2015, an NMR spectrometer cost around 0.5–5millionUSD.[3][4] Modern NMR spectrometers have a very strong, large and expensive liquid-helium-cooled superconducting magnet, because resolution directly depends on magnetic field strength. Higher magnetic field also improves the sensitivity of the NMR spectroscopy, which depends on the population difference between the two nuclear levels, which increases exponentially with the magnetic field strength.
Less expensive machines using permanent magnets and lower resolution are also available, which still give sufficient performance for certain applications such as reaction monitoring and quick checking of samples. There are even benchtop nuclear magnetic resonance spectrometers. NMR spectra of protons (1H nuclei) can be observed even in Earth magnetic field. Low-resolution NMR produces broader peaks, which can easily overlap one another, causing issues in resolving complex structures. The use of higher-strength magnetic fields result in a better sensitivity and higher resolution of the peaks, and it is preferred for research purposes.[5]
The key determinant of NMR activity in atomic nuclei is the nuclear spin quantum number (I). This intrinsic quantum property, similar to an atom's "spin", characterizes the angular momentum of the nucleus. To be NMR-active, a nucleus must have a non-zero nuclear spin (I ≠ 0).[8] It is this non-zero spin that enables nuclei to interact with external magnetic fields and show signals in NMR. Atoms with an odd sum of protons and neutrons exhibit half-integer values for the nuclear spin quantum number (I = 1/2, 3/2, 5/2, and so on). These atoms are NMR-active because they possess non-zero nuclear spin. Atoms with an even sum but both an odd number of protons and an odd number of neutrons exhibit integer nuclear spins (I = 1, 2, 3, and so on). Conversely, atoms with an even number of both protons and neutrons have a nuclear spin quantum number of zero (I = 0), and therefore are not NMR-active.[9] NMR-active nuclei, particularly those with a spin quantum number of 1/2, are of great significance in NMR spectroscopy. Examples include 1H, 13C, 15N, and 31P.[10] Some atoms with very high spin (as 9/2 for 99Tc atom) are also extensively studied with NMR spectroscopy.[11]
Main aspects of NMR techniques
Resonant frequency
When placed in a magnetic field, NMR active nuclei (such as 1H or 13C) absorb electromagnetic radiation at a frequency characteristic of the isotope.[12] The resonant frequency, energy of the radiation absorbed, and the intensity of the signal are proportional to the strength of the magnetic field. For example, in a 21-tesla magnetic field, hydrogen nuclei (protons) resonate at 900MHz. It is common to refer to a 21T magnet as a 900MHz magnet, since hydrogen is the most common nucleus detected. However, different nuclei will resonate at different frequencies at this field strength in proportion to their nuclear magnetic moments.[citation needed]
Sample handling
The NMR sample is prepared in a thin-walled glass tube– an NMR tube.
An NMR spectrometer typically consists of a spinning sample-holder inside a very strong magnet, a radio-frequency emitter, and a receiver with a probe (an antenna assembly) that goes inside the magnet to surround the sample, optionally gradient coils for diffusion measurements, and electronics to control the system. Spinning the sample is usually necessary to average out diffusional motion, however, some experiments call for a stationary sample when solution movement is an important variable. For instance, measurements of diffusion constants (diffusion ordered spectroscopy or DOSY)[13][14] are done using a stationary sample with spinning off, and flow cells can be used for online analysis of process flows.
Deuterated solvents
The vast majority of molecules in a solution are solvent molecules, and most regular solvents are hydrocarbons and so contain NMR-active hydrogen-1 nuclei. In order to avoid having the signals from solvent hydrogen atoms overwhelm the experiment and interfere in analysis of the dissolved analyte, deuterated solvents are used where >99% of the protons are replaced with deuterium (hydrogen-2).[15] The most widely used deuterated solvent is deuterochloroform (CDCl3), although other solvents may be used for various reasons, such as solubility of a sample, desire to control hydrogen bonding, or melting or boiling points. The chemical shifts of a molecule change slightly between solvents, and therefore the solvent used is almost always reported with chemical shifts.[citation needed]Proton NMR spectra are often calibrated against the known solvent residual proton peak[16] as an internal standard instead of adding tetramethylsilane (TMS), which is conventionally defined as having a chemical shift of zero.[17]
Shim and lock
To detect the very small frequency shifts due to nuclear magnetic resonance, the applied magnetic field must be extremely uniform throughout the sample volume. High-resolution NMR spectrometers use shims to adjust the homogeneity of the magnetic field to parts per billion (ppb) in a volume of a few cubic centimeters. In order to detect and compensate for inhomogeneity and drift in the magnetic field, the spectrometer maintains a "lock" on the solvent deuterium frequency with a separate lock unit, which is essentially an additional transmitter and RF processor tuned to the lock nucleus (deuterium) rather than the nuclei of the sample of interest.[18] In modern NMR spectrometers shimming is adjusted automatically, though in some cases the operator has to optimize the shim parameters manually to obtain the best possible resolution.[18][19]
Acquisition of spectra
Upon excitation of the sample with a radio frequency (60–1000MHz) pulse, a nuclear magnetic resonance response– a free induction decay (FID)– is obtained. It is a very weak signal and requires sensitive radio receivers to pick up. A Fourier transform is carried out to extract the frequency-domain spectrum from the raw time-domain FID. A spectrum from a single FID has a low signal-to-noise ratio, but it improves readily with averaging of repeated acquisitions. Good 1H NMR spectra can be acquired with 16 repeats, which takes only minutes. However, for elements heavier than hydrogen, the relaxation time is rather long, e.g. around 8seconds for 13C. Thus, acquisition of quantitative heavy-element spectra can be time-consuming, taking tens of minutes to hours.[citation needed]
Following the pulse, the nuclei are, on average, excited to a certain angle vs. the spectrometer magnetic field. The extent of excitation can be controlled with the pulse width, typically about 3–8μs for the optimal 90° pulse. The pulse width can be determined by plotting the (signed) intensity as a function of pulse width. It follows a sine curve and, accordingly, changes sign at pulse widths corresponding to 180° and 360° pulses.[citation needed]
Decay times of the excitation, typically measured in seconds, depend on the effectiveness of relaxation, which is faster for lighter nuclei and in solids, slower for heavier nuclei and in solutions, and can be very long in gases. If the second excitation pulse is sent prematurely before the relaxation is complete, the average magnetization vector has not decayed to ground state, which affects the strength of the signal in an unpredictable manner. In practice, the peak areas are then not proportional to the stoichiometry; only the presence, but not the amount of functional groups is possible to discern. An inversion recovery experiment can be done to determine the relaxation time and thus the required delay between pulses. A 180° pulse, an adjustable delay, and a 90° pulse is transmitted. When the 90° pulse exactly cancels out the signal, the delay corresponds to the time needed for 90° of relaxation.[20] Inversion recovery is worthwhile for quantitative 13C, 2D and other time-consuming experiments.
Spectral interpretation
NMR signals are ordinarily characterized by three variables: chemical shift, spin–spin coupling, and relaxation time.
Example of the chemical shift: NMR spectrum of hexaborane B6H10 showing peaks shifted in frequency, which give clues as to the molecular structure (click to read interpretation details)
The energy difference ΔE between nuclear spin states is proportional to the magnetic field (Zeeman effect). ΔE is also sensitive to the electronic environment of the nucleus, giving rise to what is known as the chemical shift, δ. The simplest types of NMR graphs are plots of the different chemical shifts of the nuclei being studied in the molecule. The value of δ is often expressed in terms of "shielding": shielded nuclei have higher ΔE. The range of δ values is called the dispersion. It is rather small for 1H signals, but much larger for other nuclei. NMR signals are reported relative to a reference signal, usually that of TMS (tetramethylsilane). Additionally, since the distribution of NMR signals is field-dependent, these frequencies are divided by the spectrometer frequency. However, since we are dividing Hz by MHz, the resulting number would be too small, and thus it is multiplied by a million. This operation therefore gives a locator number called the "chemical shift" with units of parts per million.[21] The chemical shift provides structural information.
The conversion of chemical shifts (and J's, see below) is called assigning the spectrum. For diamagnetic organic compounds, assignments of 1H and 13C NMR spectra are extremely sophisticated because of the large databases and easy computational tools. In general, chemical shifts for protons are highly predictable, since the shifts are primarily determined by shielding effects (electron density). The chemical shifts for many heavier nuclei are more strongly influenced by other factors, including excited states ("paramagnetic" contribution to shielding tensor). This paramagnetic contribution, which is unrelated to paramagnetism) not only disrupts trends in chemical shifts, which complicates assignments, but it also gives rise to very large chemical shift ranges. For example, most 1H NMR signals for most organic compounds are within 15ppm. For 31P NMR, the range is hundreds of ppm.[22]
In paramagnetic NMR spectroscopy, the samples are paramagnetic, i.e. they contain unpaired electrons. The paramagnetism gives rise to very diverse chemical shifts. In 1H NMR spectroscopy, the chemical shift range can span up to thousands of ppm.[23]
Some of the most useful information for structure determination in a one-dimensional NMR spectrum comes from J-coupling, or scalar coupling (a special case of spin–spin coupling), between NMR active nuclei. This coupling arises from the interaction of different spin states through the chemical bonds of a molecule and results in the splitting of NMR signals. For a proton, the local magnetic field is slightly different depending on whether an adjacent nucleus points towards or against the spectrometer magnetic field, which gives rise to two signals per proton instead of one. These splitting patterns can be complex or simple and, likewise, can be straightforwardly interpretable or deceptive. This coupling provides detailed insight into the connectivity of atoms in a molecule.[citation needed]
The multiplicity of the splitting is an effect of the spins of the nuclei that are coupled and the number of such nuclei involved in the coupling. Coupling to n equivalent spin-1/2 nuclei splits the signal into a n+1 multiplet with intensity ratios following Pascal's triangle as described in the table. Coupling to additional spins leads to further splittings of each component of the multiplet, e.g. coupling to two different spin-1/2 nuclei with significantly different coupling constants leads to a doublet of doublets (abbreviation: dd). Note that coupling between nuclei that are chemically equivalent (that is, have the same chemical shift) has no effect on the NMR spectra, and couplings between nuclei that are distant (usually more than 3 bonds apart for protons in flexible molecules) are usually too small to cause observable splittings. Long-range couplings over more than three bonds can often be observed in cyclic and aromatic compounds, leading to more complex splitting patterns.[citation needed]
Example H NMR spectrum (1-dimensional) of ethanol plotted as signal intensity vs. chemical shift. There are three different types of H atoms in ethanol regarding NMR: the hydrogen (H) on the −OH group is not coupling with the other H atoms and appears as a singlet, but the CH3− and the −CH2− hydrogens are coupling with each other, resulting in a triplet and quartet respectively.
For example, in the proton spectrum for ethanol, the CH3 group is split into a triplet with an intensity ratio of 1:2:1 by the two neighboring CH2 protons. Similarly, the CH2 is split into a quartet with an intensity ratio of 1:3:3:1 by the three neighboring CH3 protons. In principle, the two CH2 protons would also be split again into a doublet to form a doublet of quartets by the hydroxyl proton, but intermolecular exchange of the acidic hydroxyl proton often results in a loss of coupling information.
Coupling to any spin-1/2 nuclei such as phosphorus-31 or fluorine-19 works in this fashion (although the magnitudes of the coupling constants may be very different). But the splitting patterns differ from those described above for nuclei with spin greater than 1/2 because the spin quantum number has more than two possible values. For instance, coupling to deuterium (a spin-1 nucleus) splits the signal into a 1:1:1 triplet because the spin1 has three spin states. Similarly, a spin-3/2 nucleus such as 35Cl splits a signal into a 1:1:1:1 quartet and so on.
Coupling combined with the chemical shift (and the integration for protons) tells us not only about the chemical environment of the nuclei, but also the number of neighboring NMR active nuclei within the molecule. In more complex spectra with multiple peaks at similar chemical shifts or in spectra of nuclei other than hydrogen, coupling is often the only way to distinguish different nuclei.
The magnitude of the coupling (the coupling constant J) is an effect of how strongly the nuclei are coupled to each other. For simple cases, this is an effect of the bonding distance between the nuclei, the magnetic moment of the nuclei, and the dihedral angle between them.
Second-order (or strong) coupling
H NMR spectrum of menthol with chemical shift in ppm on the horizontal axis. Each magnetically inequivalent proton has a characteristic shift, and couplings to other protons appear as splitting of the peaks into multiplets: e.g. peak a, because of the three magnetically equivalent protons in methyl group a, couple to one adjacent proton (e) and thus appears as a doublet.
The above description assumes that the coupling constant is small in comparison with the difference in NMR frequencies between the inequivalent spins. If the shift separation decreases (or the coupling strength increases), the multiplet intensity patterns are first distorted, and then become more complex and less easily analyzed (especially if more than two spins are involved). Intensification of some peaks in a multiplet is achieved at the expense of the remainder, which sometimes almost disappear in the background noise, although the integrated area under the peaks remains constant. In most high-field NMR, however, the distortions are usually modest, and the characteristic distortions (roofing) can in fact help to identify related peaks.
Some of these patterns can be analyzed with the method published by John Pople,[24] though it has limited scope.
Second-order effects decrease as the frequency difference between multiplets increases, so that high-field (i.e. high-frequency) NMR spectra display less distortion than lower-frequency spectra. Early spectra at 60MHz were more prone to distortion than spectra from later machines typically operating at frequencies at 200MHz or above.
Furthermore, as in the figure to the right, J-coupling can be used to identify ortho-meta-para substitution of a ring. Ortho coupling is the strongest at 15Hz, Meta follows with an average of 2Hz, and finally para coupling is usually insignificant for studies.
More subtle effects can occur if chemically equivalent spins (i.e., nuclei related by symmetry and so having the same NMR frequency) have different coupling relationships to external spins. Spins that are chemically equivalent but are not indistinguishable (based on their coupling relationships) are termed magnetically inequivalent. For example, the 4 H sites of 1,2-dichlorobenzene divide into two chemically equivalent pairs by symmetry, but an individual member of one of the pairs has different couplings to the spins making up the other pair.
Magnetic inequivalence can lead to highly complex spectra, which can only be analyzed by computational modeling. Such effects are more common in NMR spectra of aromatic and other non-flexible systems, while conformational averaging about C−C bonds in flexible molecules tends to equalize the couplings between protons on adjacent carbons, reducing problems with magnetic inequivalence.
Correlation spectroscopy is one of several types of two-dimensional nuclear magnetic resonance (NMR) spectroscopy or 2D-NMR. This type of NMR experiment is best known by its acronym, COSY. Other types of two-dimensional NMR include J-spectroscopy, exchange spectroscopy (EXSY), Nuclear Overhauser effect spectroscopy (NOESY), total correlation spectroscopy (TOCSY), and heteronuclear correlation experiments, such as HSQC, HMQC, and HMBC. In correlation spectroscopy, emission is centered on the peak of an individual nucleus; if its magnetic field is correlated with another nucleus by through-bond (COSY, HSQC, etc.) or through-space (NOE) coupling, a response can also be detected on the frequency of the correlated nucleus. Two-dimensional NMR spectra provide more information about a molecule than one-dimensional NMR spectra and are especially useful in determining the structure of a molecule, particularly for molecules that are too complicated to work with using one-dimensional NMR. The first two-dimensional experiment, COSY, was proposed by Jean Jeener, a professor at Université Libre de Bruxelles, in 1971.[25][26] This experiment was later implemented by Walter P. Aue, Enrico Bartholdi and Richard R. Ernst, who published their work in 1976.[27]
Solid-state nuclear magnetic resonance
Solid-state 900 MHz (21.1 T ) NMR spectrometer at the Canadian National Ultrahigh-field NMR Facility for Solids
A variety of physical circumstances do not allow molecules to be studied in solution, and at the same time not by other spectroscopic techniques to an atomic level, either. In solid-phase media, such as crystals, microcrystalline powders, gels, anisotropic solutions, etc., it is in particular the dipolar coupling and chemical shift anisotropy that become dominant to the behaviour of the nuclear spin systems. In conventional solution-state NMR spectroscopy, these additional interactions would lead to a significant broadening of spectral lines. A variety of techniques allows establishing high-resolution conditions, that can, at least for 13C spectra, be comparable to solution-state NMR spectra.
Two important concepts for high-resolution solid-state NMR spectroscopy are the limitation of possible molecular orientation by sample orientation, and the reduction of anisotropic nuclear magnetic interactions by sample spinning. Of the latter approach, fast spinning around the magic angle is a very prominent method, when the system comprises spin-1/2 nuclei. Spinning rates of about 20kHz are used, which demands special equipment. A number of intermediate techniques, with samples of partial alignment or reduced mobility, is currently[when?] being used in NMR spectroscopy.[citation needed]
Applications in which solid-state NMR effects occur are often related to structure investigations on membrane proteins, protein fibrils or all kinds of polymers, and chemical analysis in inorganic chemistry, but also include "exotic" applications like the plant leaves and fuel cells. For example, Rahmani et al. studied the effect of pressure and temperature on the bicellar structures' self-assembly using deuterium NMR spectroscopy.[29] Solid-state NMR is useful also for metal structure understanding in case of X-ray amorphous metal samples (like nano-size refractory metal 99Tc) .[30] Recent studies have combined solid-state NMR with molecular dynamics simulations to resolve nanosecond-to-millisecond-scale motions in hydrated materials like amorphous calcium carbonate.[31]
Much of the innovation within NMR spectroscopy has been within the field of protein NMR spectroscopy, an important technique in structural biology. A common goal of these investigations is to obtain high resolution 3-dimensional structures of the protein, similar to what can be achieved by X-ray crystallography. In contrast to X-ray crystallography, NMR spectroscopy is usually limited to proteins smaller than 35 kDa, although larger structures have been solved. NMR spectroscopy is often the only way to obtain high resolution information on partially or wholly intrinsically unstructured proteins. It is now a common tool for the determination of Conformation Activity Relationships where the structure before and after interaction with, for example, a drug candidate is compared to its known biochemical activity. Proteins are orders of magnitude larger than the small organic molecules discussed earlier in this article, but the basic NMR techniques and some NMR theory also applies. Because of the much higher number of atoms present in a protein molecule in comparison with a small organic compound, the basic 1D spectra become crowded with overlapping signals to an extent where direct spectral analysis becomes untenable. Therefore, multidimensional (2, 3 or 4D) experiments have been devised to deal with this problem. To facilitate these experiments, it is desirable to isotopically label the protein with 13C and 15N because the predominant naturally occurring isotope 12C is not NMR-active and the nuclear quadrupole moment of the predominant naturally occurring 14N isotope prevents high resolution information from being obtained from this nitrogen isotope. The most important method used for structure determination of proteins utilizes NOE experiments to measure distances between atoms within the molecule. Subsequently, the distances obtained are used to generate a 3D structure of the molecule by solving a distance geometry problem. NMR can also be used to obtain information on the dynamics and conformational flexibility of different regions of a protein.
Nucleic acid NMR is the use of NMR spectroscopy to obtain information about the structure and dynamics of polynucleic acids, such as DNA or RNA. As of 2003[update], nearly half of all known RNA structures had been determined by NMR spectroscopy.[32]
Nucleic acid and protein NMR spectroscopy are similar but differences exist. Nucleic acids have a smaller percentage of hydrogen atoms, which are the atoms usually observed in NMR spectroscopy, and because nucleic acid double helices are stiff and roughly linear, they do not fold back on themselves to give "long-range" correlations.[33] The types of NMR usually done with nucleic acids are 1H or proton NMR, 13C NMR, 15N NMR, and 31P NMR. Two-dimensional NMR methods are almost always used, such as correlation spectroscopy (COSY) and total coherence transfer spectroscopy (TOCSY) to detect through-bond nuclear couplings, and nuclear Overhauser effect spectroscopy (NOESY) to detect couplings between nuclei that are close to each other in space.[34]
Parameters taken from the spectrum, mainly NOESY cross-peaks and coupling constants, can be used to determine local structural features such as glycosidic bond angles, dihedral angles (using the Karplus equation), and sugar pucker conformations. For large-scale structure, these local parameters must be supplemented with other structural assumptions or models, because errors add up as the double helix is traversed, and unlike with proteins, the double helix does not have a compact interior and does not fold back upon itself. NMR is also useful for investigating nonstandard geometries such as bent helices, non-Watson–Crick basepairing, and coaxial stacking. It has been especially useful in probing the structure of natural RNA oligonucleotides, which tend to adopt complex conformations such as stem-loops and pseudoknots. NMR is also useful for probing the binding of nucleic acid molecules to other molecules, such as proteins or drugs, by seeing which resonances are shifted upon binding of the other molecule.[34]
Carbohydrate NMR spectroscopy addresses questions on the structure and conformation of carbohydrates. The analysis of carbohydrates by 1H NMR is challenging due to the limited variation in functional groups, which leads to 1H resonances concentrated in narrow bands of the NMR spectrum. In other words, there is poor spectral dispersion. The anomeric proton resonances are segregated from the others due to fact that the anomeric carbons bear two oxygen atoms. For smaller carbohydrates, the dispersion of the anomeric proton resonances facilitates the use of 1D TOCSY experiments to investigate the entire spin systems of individual carbohydrate residues.
Drug discovery
Knowledge of energy minima and rotational energy barriers of small molecules in solution can be found using NMR, e.g. looking at free ligand conformational preferences and conformational dynamics, respectively. This can be used to guide drug design hypotheses, since experimental and calculated values are comparable. For example, AstraZeneca uses NMR for its oncology research & development.[35]
High-pressure NMR spectroscopy
One of the first scientific works devoted to the use of pressure as a variable parameter in NMR experiments was the work of J.Jonas published in the journal Annual Review of Biophysics in 1994.[36] The use of high pressures in NMR spectroscopy was primarily driven by the desire to study biochemical systems, where the use of high pressure allows controlled changes in intermolecular interactions without significant perturbations.
Of course, attempts have been made to solve scientific problems using high-pressure NMR spectroscopy. However, most of them were difficult to reproduce due to the problem of equipment for creating and maintaining high pressure. In [37][38][39] the most common types of NMR cells for realization of high-pressure NMR experiments are given.[clarification needed]
High-pressure NMR spectroscopy has been widely used for a variety of applications, mainly related to the characterization of the structure of protein molecules.[40][41] However, in recent years, software and design solutions have been proposed to characterize the chemical and spatial structures of small molecules in a supercritical fluid environment,[42] using state parameters as a driving force for such changes.[43]
↑Hanson, John E. (2013). "5. NMR Spectroscopy in Nondeuterated Solvents (No-D NMR): Applications in the Undergraduate Organic Laboratory". NMR Spectroscopy in the Undergraduate Curriculum. ACS Symposium Series. Vol.1128. American Chemical Society. pp.69–81. doi:10.1021/bk-2013-1128.ch005. ISBN978-0-8412-2794-1.
↑Ott, J. C.; Wadepohl, H.; Enders, M.; Gade, L. H. (2018). "Taking Solution Proton NMR to Its Extreme: Prediction and Detection of a Hydride Resonance in an Intermediate-Spin Iron Complex". J. Am. Chem. Soc. 140 (50): 17413–17417. Bibcode:2018JAChS.14017413O. doi:10.1021/jacs.8b11330. PMID30486649. S2CID207195859.
↑Pople, J. A.; Bernstein, H. J.; Schneider, W. G. (1957). "The Analysis of Nuclear Magnetic Resonance Spectra". Can. J. Chem. 35: 65–81. doi:10.1139/v57-143.
↑Aue, W. P. (1976). "Two-dimensional spectroscopy. Application to nuclear magnetic resonance". The Journal of Chemical Physics. 64 (5): 2229. Bibcode:1976JChPh..64.2229A. doi:10.1063/1.432450.
↑A. Rahmani, C. Knight, and M. R. Morrow. "Response to hydrostatic pressure of bicellar dispersions containing anionic lipid: Pressure-induced interdigitation". 2013, 29 (44), pp.13481–13490, doi:10.1021/la4035694.
↑Addess, Kenneth J.; Feigon, Juli (1996). "Introduction to 1H NMR Spectroscopy of DNA". In Hecht, Sidney M. (ed.). Bioorganic Chemistry: Nucleic Acids. New York: Oxford University Press. ISBN978-0-19-508467-2.
12Wemmer, David (2000). "Chapter 5: Structure and Dynamics by NMR". In Bloomfield, Victor A.; Crothers, Donald M.; Tinoco, Ignacio (eds.). Nucleic acids: Structures, Properties, and Functions. Sausalito, California: University Science Books. ISBN978-0-935702-49-1.
↑Gagné, Donald; Azad, Roksana; Aramini, James M.; Xu, Xingjian; Isiorho, Eta A.; Edupuganti, Uthama R.; Williams, Justin; Marcelino, Leandro Pimentel; Akasaka, Kazuyuki (2020-08-26). Use of High Pressure NMR Spectroscopy to Rapidly Identify Proteins with Internal Ligand-Binding Voids (Report). Biophysics. doi:10.1101/2020.08.25.267195.
The Basics of NMR - A non-technical overview of NMR theory, equipment, and techniques by Dr. Joseph Hornak, Professor of Chemistry at RIT
GAMMA and PyGAMMA Libraries - GAMMA is an open source C++ library written for the simulation of Nuclear Magnetic Resonance Spectroscopy experiments. PyGAMMA is a Python wrapper around GAMMA.
Vespa - VeSPA (Versatile Simulation, Pulses and Analysis) is a free software suite composed of three Python applications. These GUI based tools are for magnetic resonance (MR) spectral simulation, RF pulse design, and spectral processing and analysis of MR data.
This page is based on this Wikipedia article Text is available under the CC BY-SA 4.0 license; additional terms may apply. Images, videos and audio are available under their respective licenses.