Vibronic spectroscopy

Last updated

Vibronic spectroscopy is a branch of molecular spectroscopy concerned with vibronic transitions: the simultaneous changes in electronic and vibrational energy levels of a molecule due to the absorption or emission of a photon of the appropriate energy. In the gas phase, vibronic transitions are accompanied by changes in rotational energy also.

Contents

Vibronic spectra of diatomic molecules have been analysed in detail; [1] emission spectra are more complicated than absorption spectra. The intensity of allowed vibronic transitions is governed by the Franck–Condon principle. Vibronic spectroscopy may provide information, such as bond length, on electronic excited states of stable molecules. It has also been applied to the study of unstable molecules such as dicarbon, C2, in discharges, flames and astronomical objects. [2] [3]

Principles

Electronic transitions are typically observed in the visible and ultraviolet regions, in the wavelength range approximately 200–700 nm (50,000–14,000 cm−1), whereas fundamental vibrations are observed below about 4000 cm−1. [note 1] When the electronic and vibrational energy changes are so different, vibronic coupling (mixing of electronic and vibrational wave functions) can be neglected and the energy of a vibronic level can be taken as the sum of the electronic and vibrational (and rotational) energies; that is, the Born–Oppenheimer approximation applies. [4] The overall molecular energy depends not only on the electronic state but also on vibrational and rotational quantum numbers, denoted v and J respectively for diatomic molecules. It is conventional to add a double prime (v", J") for levels of the electronic ground state and a single prime (v, J) for electronically excited states.

Each electronic transition may show vibrational coarse structure, and for molecules in the gas phase, rotational fine structure. This is true even when the molecule has a zero dipole moment and therefore has no vibration-rotation infrared spectrum or pure rotational microwave spectrum. [5]

It is necessary to distinguish between absorption and emission spectra. With absorption the molecule starts in the ground electronic state, and usually also in the vibrational ground state v" = 0 because at ordinary temperatures the energy necessary for vibrational excitation is large compared to the average thermal energy. The molecule is excited to another electronic state and to many possible vibrational states v' = 0, 1, 2, 3, .... With emission, the molecule can start in various populated vibrational states, and finishes in the electronic ground state in one of many populated vibrational levels. The emission spectrum is more complicated than the absorption spectrum of the same molecule because there are more changes in vibrational energy level.

The Morse potential (blue) and harmonic oscillator potential (green). The potential at infinite internuclear distance is the dissociation energy for pure vibrational spectra. For vibronic spectra there are two potential curves (see Figure at right), and the dissociation limit is the upper state energy at infinite distance. Morse-potential.png
The Morse potential (blue) and harmonic oscillator potential (green). The potential at infinite internuclear distance is the dissociation energy for pure vibrational spectra. For vibronic spectra there are two potential curves (see Figure at right), and the dissociation limit is the upper state energy at infinite distance.
Energy level diagram illustrating the Franck-Condon principle. Transitions between v" = 0 and v' = 2 are favored. Franck-Condon-diagram.png
Energy level diagram illustrating the Franck–Condon principle. Transitions between v" = 0 and v' = 2 are favored.

For absorption spectra, the vibrational coarse structure for a given electronic transition forms a single progression, or series of transitions with a common level, here the lower level v" = 0. [6] There are no selection rules for vibrational quantum numbers, which are zero in the ground vibrational level of the initial electronic ground state, but can take any integer values in the final electronic excited state. The term values G(v) for a harmonic oscillator are given by

where v is a vibrational quantum number, and ωe is the harmonic wavenumber. In the next approximation the term values are given by

where χe is an anharmonicity constant. This is, in effect, a better approximation to the Morse potential near the potential minimum. The spacing between adjacent vibrational lines decreases with increasing quantum number because of anharmonicity in the vibration. Eventually the separation decreases to zero when the molecule photo-dissociates into a continuum of states. The second formula is adequate for small values of the vibrational quantum number. For higher values further anharmonicity terms are needed as the molecule approaches the dissociation limit, at the energy corresponding to the upper (final state) potential curve at infinite internuclear distance.

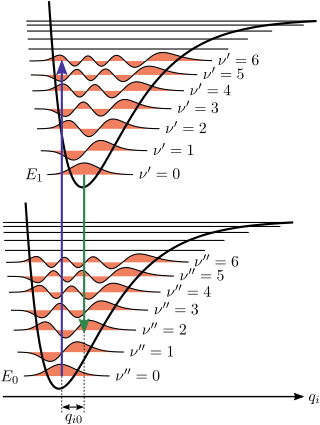
The intensity of allowed vibronic transitions is governed by the Franck–Condon principle. [7] The intensity distribution within a progression is governed by the difference in the equilibrium bond lengths of the initial electronic ground state and the final electronic excited state of the molecule. In accordance with the Born-Oppenheimer approximation, where electronic motion is near instantaneous compared to nuclear motion, transitions between vibrational levels happen with essentially no change in nuclear coordinates between the ground and excited electronic states. These nuclear coordinates are referred to as classical "turning points", where the equilibrium bond lengths of the initial and final electronic states are equal [8] . These transitions can be represented as vertical lines between the various vibrational levels within electronic states on an energy level diagram.

It is generally true that the greater the changes to the bond length of a molecule upon excitation, the greater the contribution of vibrational states to a progression. The width of this progression itself is dependent on the range of transition energies available for internuclear distances close to the turning points of the initial vibration state. As the "well" of the potential energy curve of the final electronic state grows steeper, there are more final vibrational states available for transitions, and thus more energy levels to yield a wider spectrum.

Emission spectra are complicated due to the variety of processes through which electronically excited molecules can spontaneously return to lower energy states. [9] . There is a tendency for molecules to undergo vibrational energy relaxation, where energy is lost non-radiatively from the Franck-Condon state (the vibrational state achieved after a vertical transition) to surroundings or to internal processes. The molecules can settle in the ground vibrational level of the excited electronic state, where they can continue to decay to various vibrational levels in the ground electronic state, before ultimately returning to the lowest vibrational level of the ground state [10] .

Image of fluorimeter used to obtain emission spectra, courtesy of NYU. FluorimeterNYU.jpg
Image of fluorimeter used to obtain emission spectra, courtesy of NYU.

If emission occurs before vibrational relaxation can occur, then the resulting fluorescence is referred to as resonance fluorescence. In this case, the emission spectrum is identical to the absorbance spectrum. Resonance fluorescence, however, is not very common and is mainly observed in small molecules (such as diatomics) in the gas phase. This lack of prevalence is due to short radiative lifetimes of the excited state, during which energy can be lost [11] . Emission from the ground vibrational level of the excited state after vibrational relaxation is much more prevalent, referred to as relaxed fluorescence. Emission peaks for a molecule exhibiting relaxed fluorescence are found at longer wavelengths than the corresponding absorption spectra, with the difference being the Stokes shift of the molecule.

Vibronic spectra of diatomic molecules in the gas phase have been analyzed in detail. [12] Vibrational coarse structure can sometimes be observed in the spectra of molecules in liquid or solid phases and of molecules in solution. Related phenomena including photoelectron spectroscopy, resonance Raman spectroscopy, luminescence, and fluorescence are not discussed in this article, though they also involve vibronic transitions.

Diatomic molecules

The vibronic spectra of diatomic molecules in the gas phase also show rotational fine structure. Each line in a vibrational progression will show P- and R-branches. For some electronic transitions there will also be a Q-branch. The transition energies, expressed in wavenumbers, of the lines for a particular vibronic transition are given, in the rigid rotor approximation, that is, ignoring centrifugal distortion, by [13]

Here B are rotational constants and J are rotational quantum numbers. (For B also, a double prime indicates the ground state and a single prime an electronically excited state.) The values of the rotational constants may differ appreciably because the bond length in the electronic excited state may be quite different from the bond length in the ground state, because of the operation of the Franck-Condon principle. The rotational constant is inversely proportional to the square of the bond length. Usually B' < B" as is true when an electron is promoted from a bonding orbital to an antibonding orbital, causing bond lengthening. But this is not always the case; if an electron is promoted from a non-bonding or antibonding orbital to a bonding orbital, there will be bond-shortening and B' > B".

Fortrat diagram created with B' = 0.8, B" = 1, showing displacement of rotational lines from the vibrational line position (at 0 cm ). Centrifugal distortion is ignored in this diagram. Fortrat diagram.png
Fortrat diagram created with B' = 0.8, B" = 1, showing displacement of rotational lines from the vibrational line position (at 0 cm ). Centrifugal distortion is ignored in this diagram.

The treatment of rotational fine structure of vibronic transitions is similar to the treatment of rotation-vibration transitions and differs principally in the fact that the ground and excited states correspond to two different electronic states as well as to two different vibrational levels. For the P-branch J' = J" – 1, so that

Similarly for the R-branch J" = J' – 1, and

Thus, the wavenumbers of transitions in both P- and R-branches are given, to a first approximation, by the single formula [13] [14]

Here positive m values refer to the R-branch (with m = +J' = J" + 1) and negative values refer to the P-branch (with m = –J"). The wavenumbers of the lines in the P-branch, on the low wavenumber side of the band origin at increase with m. In the R-branch, for the usual case that B' < B", as J increases the wavenumbers at first lie increasingly on the high wavenumber side of the band origin but then start to decrease, eventually lying on the low wavenumber side. The Fortrat diagram illustrates this effect. [note 2] In the rigid rotor approximation the line wavenumbers lie on a parabola which has a maximum at

The line of highest wavenumber in the R-branch is known as the band head. It occurs at the value of m which is equal to the integer part of x, or of (x + 1).

When a Q-branch is allowed for a particular electronic transition, the lines of the Q-branch correspond to the case J = 0, J' = J" and wavenumbers are given by [15]

The Q-branch then consists of a series of lines with increasing separation between adjacent lines as J increases. When B' < B" the Q-branch lies to lower wavenumbers relative to the vibrational line.

Predissociation

The phenomenon of predissociation occurs when an electronic transition results in dissociation of the molecule at an excitation energy less than the normal dissociation limit of the upper state. This can occur when the potential energy curve of the upper state crosses the curve for a repulsive state, so that the two states have equal energy at some internuclear distance. This allows the possibility of a radiationless transition to the repulsive state whose energy levels form a continuum, so that there is blurring of the particular vibrational band in the vibrational progression. [16]

Applications

Spectrum of the blue flame from a butane torch showing excited molecular radical band emission and Swan bands due to C2. Spectrum of blue flame.png
Spectrum of the blue flame from a butane torch showing excited molecular radical band emission and Swan bands due to C2.

The analysis of vibronic spectra of diatomic molecules provides information concerning both the ground electronic state and the excited electronic state. Data for the ground state can also be obtained by vibrational or pure rotational spectroscopy, but data for the excited state can only be obtained from the analysis of vibronic spectra. For example, the bond length in the excited state may be derived from the value of the rotational constant B′. In addition to stable diatomic molecules, vibronic spectroscopy has been used to study unstable species, including CH, NH, hydroxyl radical, OH, and cyano radical, CN. [17] The Swan bands in hydrocarbon flame spectra are a progression in the C-C stretching vibration of the dicarbon radical, C2 for the electronic transition. [18] Vibronic bands for 9 other electronic transitions of C2 have been observed in the infrared and ultraviolet regions. [2]

Polyatomic molecules and ions

Formaldehyde Formaldehyde-2D.svg
Formaldehyde

For polyatomic molecules, progressions are most often observed when the change in bond lengths upon electronic excitation coincides with the change due to a ″totally symmetric″ vibration. [note 3] This is the same process that occurs in resonance Raman spectroscopy. For example, in formaldehyde (methanal), H2CO, the n → π* transition involves excitation of an electron from a non-bonding orbital to an antibonding pi orbital which weakens and lengthens the C-O bond. This produces a long progression in the C-O stretching vibration. [19] [20] Another example is furnished by benzene, C6H6. In both gas and liquid phase the band around 250 nm shows a progression in the symmetric ring-breathing vibration. [21]

Absorption spectrum of an aqueous solution of potassium permanganate Permanganate spectrum.png
Absorption spectrum of an aqueous solution of potassium permanganate

As an example from inorganic chemistry the permanganate ion, MnO
4
, in aqueous solution has an intense purple colour due to an O → Mn ligand-to-metal charge transfer band (LMCT) in much of the visible region. [22] This band shows a progression in the symmetric Mn-O stretching vibration. [23] The individual lines overlap each other extensively, giving rise to a broad overall profile with some coarse structure.

Progressions in vibrations which are not totally symmetric may also be observed. [24]

d-d electronic transitions in atoms in a centrosymmetric environment are electric-dipole forbidden by the Laporte rule. This will apply to octahedral coordination compounds of the transition metals. The spectra of many of these complexes have some vibronic character. [25] The same rule also applies to f-f transitions in centrosymmetric complexes of lanthanides and actinides. In the case of the octahedral actinide chloro-complex of uranium(IV), UCl62− the observed electronic spectrum is entirely vibronic. At the temperature of liquid helium, 4K, the vibronic structure was completely resolved, with zero intensity for the purely electronic transition, and three side-lines corresponding to the asymmetric U-Cl stretching vibration and two asymmetric Cl-U-Cl bending modes. [26] Later studies on the same anion were also able to account for vibronic transitions involving low-frequency lattice vibrations. [27]

Notes

  1. Energy is related to wavenumber by , where h is Planck's constant and c is the velocity of light
  2. When centrifugal distortion is included the R-branch lines below the vibrational origin do not coincide with P-branch lines
  3. In a ″totally symmetric″ vibration the lengths of all symmetrically-equivalent bonds vary in phase with each other. The symmetry of the molecule is the same in the vibrational excited state as in the vibrational ground state.

Related Research Articles

<span class="mw-page-title-main">Diatomic molecule</span> Molecule composed of any two atoms

Diatomic molecules are molecules composed of only two atoms, of the same or different chemical elements. If a diatomic molecule consists of two atoms of the same element, such as hydrogen or oxygen, then it is said to be homonuclear. Otherwise, if a diatomic molecule consists of two different atoms, such as carbon monoxide or nitric oxide, the molecule is said to be heteronuclear. The bond in a homonuclear diatomic molecule is non-polar.

<span class="mw-page-title-main">Infrared spectroscopy</span> Measurement of infrared radiations interaction with matter

Infrared spectroscopy is the measurement of the interaction of infrared radiation with matter by absorption, emission, or reflection. It is used to study and identify chemical substances or functional groups in solid, liquid, or gaseous forms. It can be used to characterize new materials or identify and verify known and unknown samples. The method or technique of infrared spectroscopy is conducted with an instrument called an infrared spectrometer which produces an infrared spectrum. An IR spectrum can be visualized in a graph of infrared light absorbance on the vertical axis vs. frequency, wavenumber or wavelength on the horizontal axis. Typical units of wavenumber used in IR spectra are reciprocal centimeters, with the symbol cm−1. Units of IR wavelength are commonly given in micrometers, symbol μm, which are related to the wavenumber in a reciprocal way. A common laboratory instrument that uses this technique is a Fourier transform infrared (FTIR) spectrometer. Two-dimensional IR is also possible as discussed below.

<span class="mw-page-title-main">Energy level</span> Different states of quantum systems

A quantum mechanical system or particle that is bound—that is, confined spatially—can only take on certain discrete values of energy, called energy levels. This contrasts with classical particles, which can have any amount of energy. The term is commonly used for the energy levels of the electrons in atoms, ions, or molecules, which are bound by the electric field of the nucleus, but can also refer to energy levels of nuclei or vibrational or rotational energy levels in molecules. The energy spectrum of a system with such discrete energy levels is said to be quantized.

<span class="mw-page-title-main">Raman spectroscopy</span> Spectroscopic technique

Raman spectroscopy is a spectroscopic technique typically used to determine vibrational modes of molecules, although rotational and other low-frequency modes of systems may also be observed. Raman spectroscopy is commonly used in chemistry to provide a structural fingerprint by which molecules can be identified.

<span class="mw-page-title-main">Emission spectrum</span> Frequencies of light emitted by atoms or chemical compounds

The emission spectrum of a chemical element or chemical compound is the spectrum of frequencies of electromagnetic radiation emitted due to electrons making a transition from a high energy state to a lower energy state. The photon energy of the emitted photons is equal to the energy difference between the two states. There are many possible electron transitions for each atom, and each transition has a specific energy difference. This collection of different transitions, leading to different radiated wavelengths, make up an emission spectrum. Each element's emission spectrum is unique. Therefore, spectroscopy can be used to identify elements in matter of unknown composition. Similarly, the emission spectra of molecules can be used in chemical analysis of substances.

Rotational–vibrational spectroscopy is a branch of molecular spectroscopy concerned with infrared and Raman spectra of molecules in the gas phase. Transitions involving changes in both vibrational and rotational states can be abbreviated as rovibrational transitions. When such transitions emit or absorb photons, the frequency is proportional to the difference in energy levels and can be detected by certain kinds of spectroscopy. Since changes in rotational energy levels are typically much smaller than changes in vibrational energy levels, changes in rotational state are said to give fine structure to the vibrational spectrum. For a given vibrational transition, the same theoretical treatment as for pure rotational spectroscopy gives the rotational quantum numbers, energy levels, and selection rules. In linear and spherical top molecules, rotational lines are found as simple progressions at both higher and lower frequencies relative to the pure vibration frequency. In symmetric top molecules the transitions are classified as parallel when the dipole moment change is parallel to the principal axis of rotation, and perpendicular when the change is perpendicular to that axis. The ro-vibrational spectrum of the asymmetric rotor water is important because of the presence of water vapor in the atmosphere.

<span class="mw-page-title-main">Fluorescence spectroscopy</span> Type of electromagnetic spectroscopy

Fluorescence spectroscopy is a type of electromagnetic spectroscopy that analyzes fluorescence from a sample. It involves using a beam of light, usually ultraviolet light, that excites the electrons in molecules of certain compounds and causes them to emit light; typically, but not necessarily, visible light. A complementary technique is absorption spectroscopy. In the special case of single molecule fluorescence spectroscopy, intensity fluctuations from the emitted light are measured from either single fluorophores, or pairs of fluorophores.

<span class="mw-page-title-main">Rotational spectroscopy</span> Spectroscopy of quantized rotational states of gases

Rotational spectroscopy is concerned with the measurement of the energies of transitions between quantized rotational states of molecules in the gas phase. The rotational spectrum of polar molecules can be measured in absorption or emission by microwave spectroscopy or by far infrared spectroscopy. The rotational spectra of non-polar molecules cannot be observed by those methods, but can be observed and measured by Raman spectroscopy. Rotational spectroscopy is sometimes referred to as pure rotational spectroscopy to distinguish it from rotational-vibrational spectroscopy where changes in rotational energy occur together with changes in vibrational energy, and also from ro-vibronic spectroscopy where rotational, vibrational and electronic energy changes occur simultaneously.

<span class="mw-page-title-main">Raman scattering</span> Inelastic scattering of photons by matter

In physics, Raman scattering or the Raman effect is the inelastic scattering of photons by matter, meaning that there is both an exchange of energy and a change in the light's direction. Typically this effect involves vibrational energy being gained by a molecule as incident photons from a visible laser are shifted to lower energy. This is called normal Stokes-Raman scattering.

<span class="mw-page-title-main">Photoemission spectroscopy</span> Examining a substance by measuring electrons emitted in the photoelectric effect

Photoemission spectroscopy (PES), also known as photoelectron spectroscopy, refers to energy measurement of electrons emitted from solids, gases or liquids by the photoelectric effect, in order to determine the binding energies of electrons in the substance. The term refers to various techniques, depending on whether the ionization energy is provided by X-ray, XUV or UV photons. Regardless of the incident photon beam, however, all photoelectron spectroscopy revolves around the general theme of surface analysis by measuring the ejected electrons.

<span class="mw-page-title-main">Molecular physics</span> Study of the physical and chemical properties of molecules

Molecular physics is the study of the physical properties of molecules and molecular dynamics. The field overlaps significantly with physical chemistry, chemical physics, and quantum chemistry. It is often considered as a sub-field of atomic, molecular, and optical physics. Research groups studying molecular physics are typically designated as one of these other fields. Molecular physics addresses phenomena due to both molecular structure and individual atomic processes within molecules. Like atomic physics, it relies on a combination of classical and quantum mechanics to describe interactions between electromagnetic radiation and matter. Experiments in the field often rely heavily on techniques borrowed from atomic physics, such as spectroscopy and scattering.

<span class="mw-page-title-main">Stokes shift</span> Difference between absorptions and emissions

Stokes shift is the difference between positions of the band maxima of the absorption and emission spectra of the same electronic transition. It is named after Irish physicist George Gabriel Stokes. Sometimes Stokes shifts are given in wavelength units, but this is less meaningful than energy, wavenumber or frequency units because it depends on the absorption wavelength. For instance, a 50 nm Stokes shift from absorption at 300 nm is larger in terms of energy than a 50 nm Stokes shift from absorption at 600 nm.

In physics and chemistry, a selection rule, or transition rule, formally constrains the possible transitions of a system from one quantum state to another. Selection rules have been derived for electromagnetic transitions in molecules, in atoms, in atomic nuclei, and so on. The selection rules may differ according to the technique used to observe the transition. The selection rule also plays a role in chemical reactions, where some are formally spin-forbidden reactions, that is, reactions where the spin state changes at least once from reactants to products.

<span class="mw-page-title-main">Franck–Condon principle</span> Quantum chemistry rule regarding vibronic transitions

The Franck–Condon principle is a rule in spectroscopy and quantum chemistry that explains the intensity of vibronic transitions. The principle states that during an electronic transition, a change from one vibrational energy level to another will be more likely to happen if the two vibrational wave functions overlap more significantly.

The Jahn–Teller effect is an important mechanism of spontaneous symmetry breaking in molecular and solid-state systems which has far-reaching consequences in different fields, and is responsible for a variety of phenomena in spectroscopy, stereochemistry, crystal chemistry, molecular and solid-state physics, and materials science. The effect is named for Hermann Arthur Jahn and Edward Teller, who first reported studies about it in 1937.

<span class="mw-page-title-main">Conical intersection</span>

In quantum chemistry, a conical intersection of two or more potential energy surfaces is the set of molecular geometry points where the potential energy surfaces are degenerate (intersect) and the non-adiabatic couplings between these states are non-vanishing. In the vicinity of conical intersections, the Born–Oppenheimer approximation breaks down and the coupling between electronic and nuclear motion becomes important, allowing non-adiabatic processes to take place. The location and characterization of conical intersections are therefore essential to the understanding of a wide range of important phenomena governed by non-adiabatic events, such as photoisomerization, photosynthesis, vision and the photostability of DNA. The conical intersection involving the ground electronic state potential energy surface of the C6H3F3+ molecular ion is discussed in connection with the Jahn–Teller effect in Section 13.4.2 on pages 380-388 of the textbook by Bunker and Jensen.

A molecular vibration is a periodic motion of the atoms of a molecule relative to each other, such that the center of mass of the molecule remains unchanged. The typical vibrational frequencies range from less than 1013 Hz to approximately 1014 Hz, corresponding to wavenumbers of approximately 300 to 3000 cm−1 and wavelengths of approximately 30 to 3 µm.

In molecular vibrational spectroscopy, a hot band is a band centred on a hot transition, which is a transition between two excited vibrational states, i.e. neither is the overall ground state. In infrared or Raman spectroscopy, hot bands refer to those transitions for a particular vibrational mode which arise from a state containing thermal population of another vibrational mode. For example, for a molecule with 3 normal modes, , and , the transition , would be a hot band, since the initial state has one quantum of excitation in the mode. Hot bands are distinct from combination bands, which involve simultaneous excitation of multiple normal modes with a single photon, and overtones, which are transitions that involve changing the vibrational quantum number for a normal mode by more than 1.

Photoelectrochemical processes are processes in photoelectrochemistry; they usually involve transforming light into other forms of energy. These processes apply to photochemistry, optically pumped lasers, sensitized solar cells, luminescence, and photochromism.

Spectral line shape describes the form of a feature, observed in spectroscopy, corresponding to an energy change in an atom, molecule or ion. This shape is also referred to as the spectral line profile. Ideal line shapes include Lorentzian, Gaussian and Voigt functions, whose parameters are the line position, maximum height and half-width. Actual line shapes are determined principally by Doppler, collision and proximity broadening. For each system the half-width of the shape function varies with temperature, pressure and phase. A knowledge of shape function is needed for spectroscopic curve fitting and deconvolution.

References

  1. Herzberg, Gerhard (1950). Molecular spectra and molecular structure (2nd. ed.). Van Nostrand.Available for download at community books
  2. 1 2 Hollas, p. 211.
  3. Parsons, M. L. (1971). Flame Spectroscopy : Atlas of Spectral Lines. Springer. ISBN   9780306651564.
  4. Banwell and McCash, p. 162.
  5. Banwell and McCash, p. 163.
  6. Hollas, p. 214
  7. Hollas, p. 215.
  8. McHale, p.259
  9. McQuarrie, pg. 592
  10. Wolf, p.75
  11. McHale, pg.
  12. Hollas, pp. 210–228
  13. 1 2 Banwell and McCash, p. 171
  14. Straughan and Walker, p. 74
  15. Hollas, p. 172.
  16. Banwell and McCash, p. 174 illustrates a spectrum with pre-dissociation.
  17. Banwell and McCash, p. 176
  18. Gaydon, p. 259.
  19. Dieke, G. H.; Kistiakowsky, G. B. (1934). "The Rotational Structure of the Ultra-Violet Absorption Bands of Formaldehyde". Proc. Natl. Acad. Sci. 18 (5): 367–372. Bibcode:1932PNAS...18..367D. doi: 10.1073/pnas.18.5.367 . PMC   1076232 . PMID   16587697.
  20. Clouthier, D. J.; Ramsay, D. A. (1983). "The Spectroscopy of Formaldehyde and Thioformaldehyde". Annual Review of Physical Chemistry. 34: 31–58. Bibcode:1983ARPC...34...31C. doi:10.1146/annurev.pc.34.100183.000335.
  21. Hollas shows the vibration on p. 140 (Fig.6.13f) and the spectrum on p. 245
  22. Housecroft C. E. and Sharpe A. G. Inorganic Chemistry (2nd ed., Pearson Prentice-Hall 2005), p. 612
  23. Neugebauer, Johannes; Baerends, Evert Jan (2005). "Vibronic Structure of the Permanganate Absorption Spectrum from Time-Dependent Density Functional Calculations" (PDF). J. Phys. Chem. 109 (6): 1168–1179. Bibcode:2005JPCA..109.1168N. doi:10.1021/jp0456990. PMID   16833427. S2CID   1612829.
  24. Hollas, p. 245.
  25. Orgel, L. E. (1966). An Introduction to Transition Metal Chemistry. Ligand field theory (2nd ed.). Methuen. p. 94.
  26. Satten, Robert A.; Young, Donald; Gruen, Dieter M. (1960). "Preliminary Analysis of U4+ Ion Spectra in Crystals". J. Chem. Phys. 33 (4): 1160–1171. Bibcode:1960JChPh..33.1140S. doi: 10.1063/1.1731348 .
  27. Pollack, S. A. (1963). "Application of Space‐Group Theory to the Vibrational Problem of di‐Tetramethyl Ammonium Uranium Hexachloride". J. Chem. Phys. 38 (1): 98–108. Bibcode:1963JChPh..38...98P. doi:10.1063/1.1733502.

Bibliography