In vivo magnetic resonance spectroscopy

Last updated

In vivo magnetic resonance spectroscopy (MRS) is a specialized technique associated with magnetic resonance imaging (MRI). [1] [2]

Contents

Magnetic resonance spectroscopy (MRS), also known as nuclear magnetic resonance (NMR) spectroscopy, is a non-invasive, ionizing-radiation-free analytical technique that has been used to study metabolic changes in brain tumors, strokes, seizure disorders, Alzheimer's disease, depression, and other diseases affecting the brain. It has also been used to study the metabolism of other organs such as muscles. In the case of muscles, NMR is used to measure the intramyocellular lipids content (IMCL). [3]

Magnetic resonance spectroscopy is an analytical technique that can be used to complement the more common magnetic resonance imaging (MRI) in the characterization of tissue. Both techniques typically acquire signal from hydrogen protons (other endogenous nuclei such as those of Carbon, Nitrogen, and Phosphorus are also used), but MRI acquires signal primarily from protons which reside within water and fat, which are approximately a thousand times more abundant than the molecules detected with MRS. As a result, MRI often uses the larger available signal to produce very clean 2D images, whereas MRS very frequently only acquires signal from a single localized region, referred to as a "voxel". MRS can be used to determine the relative concentrations and physical properties of a variety of biochemicals frequently referred to as "metabolites" due to their role in metabolism.

Data Acquisition

Acquiring an MRS scan is very similar to that of MRI with a few additional steps preceding data acquisition. These steps include:

  1. Shimming the magnetic field: this step is taken to correct for the inhomogeneity of the magnetic field by tuning different pulses in the x, y, and z directions. This step is usually automated but can be performed manually.
  2. Suppressing the water signal: because water molecules contain hydrogen, and the relative concentration of water to metabolite is about 10,000:1, the water signal is often suppressed or the metabolite peaks will not be discernible in the spectra. This is achieved by adding water suppression pulses. Recent advances allow proton MRS without water suppression. [4]
  3. Choosing a spectroscopic technique: careful planning of measurements is important in the context of a specific experiment.
    1. Single Voxel Spectroscopy (SVS): has a minimum spatial resolution of approximately 1 cm3, and has the cleanest spectrum free from unwanted artifacts due to the small acquired volume leading to easy shim and less unwanted signals from outside the voxel.
    2. Magnetic Resonance Spectroscopic Imaging (MRSI): a 2-dimensional (or 3-dimensional) MRS technique which uses two/three phase-encoding directions to create a two/three-dimensional map of spectra. The drawbacks of this technique is that having two/three phase encoding directions requires lengthy scan time, and the larger volume of acquisition is more likely to introduce artefacts due to poorer shimming, unsuppressed water, as well as the inherent sinc point-spread-function due to the finite sampling of k-space which results in the signal from one voxel bleeding into all others.

Data Quantification

During data acquisition, the scan acquires raw data in the form of spectra. This raw data must be quantified to achieve a meaningful understanding of the spectrum. This quantification is achieved via linear combination. [5] Linear combination requires knowledge of the underlying spectral shapes, referred to as basis sets. Basis sets are acquired either via numerical simulation or experimentally measured in phantoms. There are numerous packages available to numerically simulate basis sets, including MARSS, [6] FID-A, [7] among others such as GAMMA, VESPA and Spinach. [8] With the basis sets, the raw data can now be quantified as measured concentrations of different chemical species. Software is used to complete this. LCModel, a commercial software, has been for most of the field's history the standard software quantification package. However, now there are many freeware packages for quantification: AMARES, AQSES, Gannet, INSPECTOR, jMRUI, TARQUIN, and more. [5]

Before linear combination, peak extraction used to be used for data quantification. However, this is no longer popular nor recommended. [5] Peak extraction is a technique which integrates the area underneath a signal. Despite its seemingly straightforwardness, there are several confounds with this technique. Chiefly, the individual Lorentzian shapes employed do not scale up to match the complexity of the spectral shapes of J-coupled metabolites and is too simple to discern between overlapping peaks. [5]

Pulse Sequences

Similar to MRI, MRS uses pulse sequences to acquire signal from several different molecules to generate a spectra instead of an image. In MRS, STEAM (Stimulated Echo Acquisition Method) and PRESS (Point Resolved Spectroscopy) are the two primary pulse sequence techniques used. In terms of advantages, STEAM is best for imaging metabolites with shorter T2 and has lower SAR, while PRESS has higher SNR than STEAM. STEAM and PRESS are most widely used due to their implementation on the major vendors of MR scanners. Beyond STEAM and PRES there are sequences which utilize adiabatic pulses. Adiabatic pulses produce uniform flip angles even when there is extreme B1 inhomogeneity. Thus, these sequences allow us to achieve excitation that achieves the sought-for B1 insensitivity and off-resonance in the RF coil and sampled object. Specifically, adiabatic pulses solve the problem of signal dropout that comes from the different B1 flux patterns that result from the surface transmit coils used and the usage of normal pulses. [9] Adiabatic pulses are also useful for constraints on RF peak power for excitation and lowering tissue heating. Additionally, adiabatic pulses have substantially higher bandwidth, which reduces chemical shift displacement artefact, which is particularly important at high field strengths and when a large range of frequencies are desired to be measured (i.e., measuring both the signals upfield and downfield of water in proton MRS).


Spatial Localization Sequences

In PRESS, the two chief drawbacks are lengthy echo time (TE) and chemical shift displacement (CSD) artifacts. [10] Lengthy echo time arises from the fact that PRESS uses two 180° pulses, unlike STEAM which uses exclusively 90° pulses. The duration of 180° pulses are generally longer than 90° pulses because it takes more energy to flip a net magnetization vector completely as opposed to only 90°. Chemical shift displacement artifacts arises partly because of less optimal slice selection profiles. Multiple 180° pulses does not allow a very short TE, resulting in less optimal slice selection profile. Additionally, multiple 180° pulses means smaller bandwidth and thus larger chemical shift displacement. Specifically, the chemical shift displacement artifacts occur because signals with different chemical shifts experience different frequency-encoded slice selections and thus do not originate from same volume. Additionally, this effect becomes greater at higher magnetic field strengths.

SPECIAL consists of a spatially selective pre-excitation inversion pulse (typically AFP) followed by spatially selective excitation and refocusing pulses, both of which are usually SLR or truncated sinc pulses. [5]

SPECIAL is a hybrid of PRESS and Image-Selected In Vivo Spectroscopy (ISIS). ISIS achieves spatial localization in the three spatial dimensions through a series of eight slice-selective preinversion pulses that can be appropriately positioned so that the sum of the eight cycles removes all signal outside the desired 3D region. [5] SPECIAL obtains spatial localization from only a single dimension with pre-excitation inversion pulses (cycled on and off every other repetition time [TR]), making it a two-cycle sequence.

The use of the preinversion pulse to remove one refocusing pulse (as compared with PRESS) is what allows SPECIAL to achieve a short TE, reaching a minimum of 2.2 msec on a preclinical scanner in rat brain while being able to recover the full signal and as low as 6 msec on a clinical 3T scanner. [5]

The largest drawback of SPECIAL and SPECIAL-sLASER is that they are two-cycle schemes, and systematic variations between cycles will manifest in their difference spectrum. Lipid contamination is a particularly large problem with SPECIAL and similar sequences.

The state-of-the-art localization sequence is sLASER, [11] which utilizes two pairs of adiabatic refocusing pulses. This has recently been recommended by consensus. [12]

The first is through OVS, which will reduce the contamination of lipid signals that originate from outside the voxel, although this comes at the cost of an increase in SAR. The second is not to set the amplitude of the pre-excitation inversion pulse to zero every other TR, but instead to shift the location of this ISIS plane such that the excited volume for the off condition is outside the object. This has been shown to greatly reduce lipid contamination, speculated to have arisen from the interaction between the RF pulse and lipid compartments due to incomplete relaxation, magnetization transfer, or the homonuclear Overhauser effect, although the exact mechanism remains unknown. [5] The third is to use an echo-planar readout that dephases magnetization from outside the voxel, also shown to substantially reduce lipid artifacts. All three methods could be combined to overcome lipid contamination. [5]

One of the dimensions to understand about a pulse sequence is its coherence pathway. The coherence pathway is the sequence of quantum coherence number(s) the signal takes prior to its acquisition. All coherence pathways end in -1, as this is the only coherence pathway detected by quadrature coils. The spin echo-type sequences (PRESS, sLASER, LASER) simply alternate between +1 and -1. For example, the coherence pathway for PRESS (expressed as a vector) is [-1, 1, -1]. This indicates that after the initial RF pulse (excitation pulse) the spins have a -1 quantum coherence. The refocusing pulses then swap the -1 to +1, then back from +1 to -1 (where it is then detected). Similarly for sLASER the coherence pathway is [-1, 1, -1, 1, -1]. The coherence pathway for LASER is [-1, 1, -1, 1, -1, 1, -1]. The coherence pathway for sPECIAL is [0, 1, -1]. This indicates that after the first RF pulse the signal resides as a population, due to its 0 quantum coherence number. Coherence pathways are critical as the explain how the sequences are affected by crushers and phase cycling. As such, coherence pathway analysis has been used to develop optimized crusher schemes [13] and phase cycling schemes [14] for an arbitrary MRS experiment.

Uses

MRS allows doctors and researchers to obtain biochemical information about the tissues of the human body in a non-invasive way (without the need for a biopsy), whereas MRI only gives them information about the structure of the body (the distribution of water and fat). [15]

For example, whereas MRI can be used to assist in the diagnosis of cancer, MRS could potentially be used to assist in information regarding to the aggressiveness of the tumor. [16] Furthermore, because many pathologies appear similar in diagnostic imaging (such as radiation-induced necrosis and recurring tumor following radiotherapy), MRS may in the future be used to assist in distinguishing between similarly appearing prognoses.

MRS equipment can be tuned (just like a radio receiver) to pick up signals from different chemical nuclei within the body. The most common nuclei to be studied are protons (hydrogen), phosphorus, carbon, sodium and fluorine.

The types of biochemicals (metabolites) which can be studied include choline-containing compounds (which are used to make cell membranes), creatine (a chemical involved in energy metabolism), inositol and glucose (both sugars), N-acetylaspartate, and alanine and lactate which are elevated in some tumors.

At present MRS is mainly used as a tool by scientists (e.g. medical physicists and biochemists) for medical research projects, but it is becoming clear that it also has the ability to give doctors useful clinical information, especially with the discovery that it can be used to probe the concentration of alpha-Hydroxyglutaric acid, which is only present in IDH1 and IDH2 mutated gliomas, which alters the prescribed treatment regimen.

MRS is currently used to investigate a number of diseases in the human body, most notably cancer (in brain, breast and prostate), epilepsy, Alzheimer's disease, Parkinson's disease, and Huntington's chorea. MRS has been used to diagnose pituitary tuberculosis. [17]

Prostate cancer: Combined with a magnetic resonance imaging (MRI) and given equal results, then the three-dimensional MRS can predict the prevalence of a malignant degeneration of prostate tissue by approximately 90%. The combination of both methods may be helpful in the planning of biopsies and therapies of the prostate, as well as to monitor the success of a therapy. [18]

Example

Shown below is an MRI brain scan (in the axial plane, that is slicing from front-to-back and side-to-side through the head) showing a brain tumor (meningioma) at the bottom right. The red box shows the volume of interest from which chemical information was obtained by MRS (a cube with 2 cm sides which produces a square when intersecting the 5 mm thick slice of the MRI scan).

Each biochemical, or metabolite, has a different peak in the spectrum which appears at a known frequency. The peaks corresponding to the amino acid alanine, are highlighted in red (at 1.4 ppm). This is an example of the kind of biochemical information which can help doctors to make their diagnosis. Other metabolites of note are choline (3.2 ppm) and creatine (3.0 ppm).

MRS localiser image.jpg MRS spectrum.gif

Applications of MRS

MetaboliteMajor Chemical Shift (ppm)Functionin vivo MRS ApplicationsClinical Applications
N-Acetyl Aspartate (NAA) [19] :52–532.01
  • Osmoregulation
  • Precursor to neurotransmitter NAAG
  • Fatty acid and myelin synthesis (via storage form for acetyl groups)
Marker of neuronal density

Concentration marker

  • Believed to reflect neuronal dysfunction rather than neuronal loss
  • Elevated levels seen in Canavan's syndrome and sickle cell disease in newborn infants and young children
  • Reduced levels seen in chronic stages of stroke, brain tumors, and multiple sclerosis
N-Acetyl Aspartyl Glutamate (NAAG) [19] :53–542.04
  • Neurotransmitter involved in excitatory neurotransmission
  • Source of glutamate
Sum of NAA and NAAG provides a reliable estimate of NAA-containing molecules
  • None
Adenosine Triphosphate (ATP) [19] :54–554.20 - 4.80, 6.13, 8.22
  • Principal donor of free energy in biological systems
Normally detected with 31P NMR spectroscopy, more difficult to detect by 1H NMR spectroscopy
  • Measure cerebral mitochondrial function
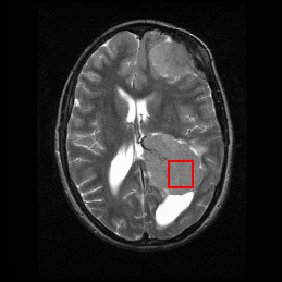
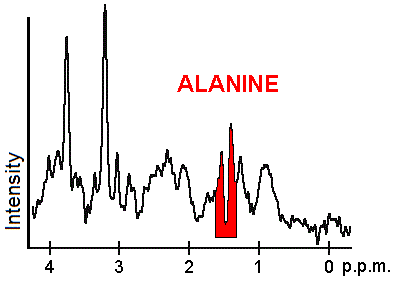
Alanine (Ala) [19] :55–561.40
  • Linked to metabolic pathways like glycolysis, gluconeogensis, and TCA cycle
None
  • Elevated levels seen in melingomas
γ-aminobutyric acid (GABA) [19] :56–573.00
  • Inhibitory neurotransmitter
  • Regulation of muscle tone
None
  • Reduced levels seen in recent seizures, schizophrenia, autism, bipolar disorder, major depressive disorder
Ascorbic Acid (Asc - Vitamin C) [19] :57–584.49
  • Antioxidant
  • Coenzyme for the formation of collagen
Target for hyperpolarized 13C applications to image the redox status in vivo
  • Measure ascorbic acid uptake
Aspartic Acid (Asc) [19] :583.89
  • Excitatory neurotransmitter
  • Metabolite in urea cycle
  • Participates in gluconeogenesis
  • Essential to malate-aspartate shuttle
None
  • None
Carnitine [19] :823.21
  • Transporting long-chain fatty acids across the mitochondrial membrane for β-oxidation
  • Regulatory role in substrate switching and glucose homeostasis
None
  • Direct correlation between carnitine content in seminal fluid and sperm count and mobility
  • Manage cardiac ischemia and peripheral arterial disease
Carnosine [19] :847.09
  • Antioxidant
  • Increase Hayflick limit in fibroblasts
  • Reduce telomere shortening rate
  • Important intramuscular buffer
Noninvasive method to measure intracellular pH with 1H NMR in vivo
  • Reduces development of atherosclerotic buildup
Choline-containing Compounds (tCho) [19] :59–613.20
  • Involved in pathways of phospholipid synthesis and degradation
None
  • Elevated levels seen in cancer, Alzheimer's disease, and multiple sclerosis
  • Reduced levels are associated with liver disease and stroke
Citric Acid2.57, 2.72
  • Intermediate of the Krebs cycle
None
  • Elevated levels in brain tumors
  • Diagnosis of malignant adenocarcinoma and benign prostatic hyperplasia
Creatine (Cr) and Phosphocreatine (PCr) [19] :61–823.03
  • Energy buffer, retaining constant ATP levels through the creatine kinase reaction
  • Energy shuttle, diffusing from energy producing (i.e. mitochondria) to energy utilizing sites (i.e. myofibrils in muscle or nerve terminals in brain)
None
  • Reduced levels seen in chronic phases of many pathologies, including tumors and strokes
Deoxymyoglobin (DMb) [19] :8779.00
  • Oxygen storage compound and facilitator of oxygen diffusion
None
  • Elevated levels in ischemic conditions (i.e. heavy exercise, using a pressure cuff)
  • Determine oxygen saturation in human skeletal and cardiac muscle
Glucose (Glc) [19] :635.22
  • Ubiquitous source of energy from bacteria to humans
  • Broken down in TCA cycle to provide energy in form of ATP
Common target in 13C applications to study metabolic pathways
  • Elevated levels in people with Alzheimer's
Glutamate (Glu) [19] :64–652.20 - 2.40
  • Major excitatory neurotransmitter
  • Direct precursor for the major inhibitory neurotransmitter GABA
  • Important precursor to synthesis of glutathione
  • Glutamate-Glutamine neurotransmitter cycle
Separation between glutamate and glutamine becomes unreliable, although the sum (Glx) can be quantified with high accuracy
  • Elevated levels in bipolar disorder
  • Reduced levels in major depressive disorder
Glutamine (Gln) [19] :65–662.20 - 2.40
  • Ammonia detoxification
  • Glutamate-Glutamine neurotransmitter cycle
Separation between glutamate and glutamine becomes unreliable, although the sum (Glx) can be quantified with high accuracy
  • Elevated levels during hyperammonemia
  • Good indicator of liver disease
  • Fuel source for a number of cancers
Glutathione (GSH) [19] :66–67>3.77
  • Antioxidant
  • Essential for maintaining normal red-blood-cell structure and keeping hemoglobin in ferrous state
  • Storage form of cysteine
None
  • Measure of cellular oxidative stress
  • Altered levels in Parkinson's disease and other neurodegenerative diseases affecting the basal ganglia
Glycerol [19] :67–683.55, 3.64, 3.77
  • Major constituent of phospholipids
Difficult to observe in 1H NMR spectra because of line broadening
  • None
Glycine [19] :683.55
  • Inhibitory neurotransmitter
  • Forms significant fraction of collagen
None
  • Elevated levels in infants with hyperglycinemia and patients with brain tumors
Glycogen [19] :68–693.83
  • Form of energy storage
  • Important role in systemic glucose metabolism
Routinely observed in 13C NMR, but remains elusive in 1H NMR
  • Altered levels in diabetes mellitus
Histidine [19] :59–707.10, 7.80
  • Precursor for histamine and carnosine biosynthesis
Establish intracellular pH in 1H NMR
  • Elevated levels in hepatic encephalopathy and histidinemia
Homocarnosine [19] :707.10, 8.10, 3.00 - 4.50
  • Associated with epileptic seizure control
Good choice for in vivo pH monitoring

Because of the overlap between GABA and Homocarnosine resonances, the GABA H-4 resonance at 3.01 ppm is the "total GABA" representing the sum of GABA and homocarnosine

  • Elevated levels seen in antiepileptic drugs, like gabapentin
  • Elevated levels in brain and CSF are associated with homocarnosinase
β-Hydroxybutyrate (BHB) [19] :70–711.19
  • Alternate substate for metabolism, typically under conditions of long fasting or high fat diets
  • Maintain acetoacetyl-CoA and acetyl-CoA for the synthesis of cholesterol, fatty acids, and complex lipids
None
  • Elevated levels believed to control seizures in childhood epilepsy
2-Hydroxyglutarate (2HG) [19] :71–721.90
  • Oncometabolite (cancer-causing)
  • Part of butanoate metabolic pathway
None
  • Elevated levels in gliomas
myo-Inositol (mI) [19] :72–733.52
  • Exact function is unknown
  • Osmotic regulation in kidney
  • Biochemical relationship to messenger-inositol polyphosphate
None
  • Altered levels in patients with mild cognitive impairment, Alzheimer's disease, and brain injury
scyllo-Inositol (sI) [19] :72–733.34
  • Reverse memory deficits
  • Reduce development of amyloid-beta (Aβ) plaques
None
  • Elevated levels during chronic alcoholism
Lactate (Lac) [19] :73–741.31
  • End product of anaerobic glycolysis
  • Links astroglial glucose uptake and metabolism to neuronal neurotransmitter cycling in astroglial-neuronal lactate shuttle hypothesis (ANLS)
None
  • Elevated levels seen in hyperventilation, tumors, ischemic stroke, hypoxia
Lipids [19] :870.9 - 1.5
  • Intramyocellular lipids represents a pool that displays active turnover and metabolism, for example, during exercise
  • Extramyocellular lipids represent an inert pool that lies between muscle fibers
High abundance of lipids is one of main reasons 1H NMR outside the brain has seen limited applications
  • Elevated levels seen in necrosis
Macromolecules [19] :74–760.93 (MM1), 1.24 (MM2), 1.43 (MM3), 1.72 (MM4), 2.05 (MM5), 2.29 (MM6), 3.00 (MM7), 3.20 (MM8), 3.8 - 4.0 (MM9), 4.3 (MM10)
  • Assignment to specific proteins is essentially impossible, but individual resonances can be assigned to amino acids
    • MM1: Leucine, Isoleucine, Valine
    • MM2 and MM3: Threonine and Alanine
    • MM4 and MM7: Lysine and Arginine
    • MM5 and MM6: Glutamate and Glutamine
    • MM8-MM10: Not very well defined to know
Significant fraction of observed signal is macromolecular resonances underlying the rest of metabolites

Short T2 relaxation time constants effectively eliminate macromolecular resonances from long-echo-time 1H NMR spectra

Difference in T1 relaxations between metabolites and macromolecules is used to reduce contribution from extracranial lipid signal

  • Alternations in macromolecular spectrum observed in stroke, tumors, multiple sclerosis, and aging
Nicotinamid Adenine Dinucleotide (NAD+) [19] :769.00
  • Coenzyme for electron-transfer enzymes
  • Substrate for ADP-ribose transferases, poly (ADP-ribose) polymerases, cADP-ribose synthases, and sirtuins
  • Involved in gene expression and repair, calcium mobilization, metabolism, aging, cancer, cell metabolism, and the timing of metabolism via the circadian rhythm
31P NMR allows detection of both NAD+ and NADH, while 1H NMR does not allow detection for NADH
  • None
Phenylalanine [19] :76–777.30 - 7.45
  • Precursor for the amino acid tyrosine which is used for catchelcolamine (dopamine, epinephrine, and norepinephrine) synthesis
None
  • Elevated levels in phenylketonuria (PKU)
  • Reduced levels in aging
Pyruvate [19] :77–782.36
  • Converted into acetyl-coenzyme A
  • Participates in the anaplerotic reaction to replenish TCA cycle intermediates
  • Neuroprotective properties in stroke
Only FDA-approved compound for hyperpolarized 13C NMR
  • Altered levels in cystic lesions and neonatal pyruvate dehydrogenase deficiency
Serine [19] :783.80 - 4.00
  • Participates in biosynthesis of purines, pyridines, cysteine, glycine, 3-phosphoglycerate, and other proteins
None
  • Elevated levels in patients with Alzheimer's
Taurine (Tau) [19] :79–803.25, 3.42
  • Exact function not known
  • Osmoregulator
  • Modulator of neurotransmitters
None
  • Reduced levels in aging
Threonine (Thr) [19] :801.32
  • Precursor to glycine
None
  • Supplement to help alleviate anxiety and some cases of depression
Tryptophan (Trp) [19] :807.20, 7.28
  • Necessary for production of serotonin, melatonin, vitamin B3 (niacin), and NAD+
None
  • Elevated levels seen in hepatic encephalopathy
  • Treatment for mild insomnia
  • Antidepressant
Tyrosine (Tyr) [19] :816.89 - 7.19
  • Precursor to the neurotransmitters epinephrine, norepinephrine, and dopamine as well as the thyroid hormones thyroxine and triiodothyronine
  • Converted to DOPA by tyrosine dehydroxylase
  • Key role in signal transduction
None
  • Elevated levels in hepatic encephalopathy
  • Reduced levels seen with aging
Water [19] :81–824.80
  • Critical for homeostasis
Internal concentration referencing

Water chemical shift used to detect temperature changes noninvasively in vivo

  • Water content only changes moderately with different pathologies

In 1H Magnetic Resonance Spectroscopy each proton can be visualized at a specific chemical shift (peak position along x-axis) depending on its chemical environment. This chemical shift is dictated by neighboring protons within the molecule. Therefore, metabolites can be characterized by their unique set of 1H chemical shifts. The metabolites that MRS probes for have known (1H) chemical shifts that have previously been identified in NMR spectra. These metabolites include:

  1. N-acetyl Aspartate (NAA): with its major resonance peak at 2.02 ppm, decrease in levels of NAA indicate loss or damage to neuronal tissue, which results from many types of insults to the brain. Its presence in normal conditions indicates neuronal and axonal integrity.
  2. Choline: with its major peak at 3.2 ppm, choline is known to be associated with membrane turnover, or increase in cell division. Increased choline indicates increase in cell production or membrane breakdown, which can suggest demyelination or presence of malignant tumors.
  3. Creatine and phosphocreatine: with its major peak at 3.0 ppm, creatine marks metabolism of brain energy. Gradual loss of creatine in conjunction with other major metabolites indicates tissue death or major cell death resulting from disease, injury or lack of blood supply. Increase in creatine concentration could be a response to cranialcerebral trauma. Absence of creatine may be indicative of a rare congenital disease.
  4. Lipids: with their major aliphatic peaks located in the 0.9–1.5 ppm range, increase in lipids is seen is also indicative of necrosis. These spectra are easily contaminated, as lipids are not only present in the brain, but also in other biological tissue such as the fat in the scalp and area between the scalp and skull.
  5. Lactate: Is an AX3 system which results in a doublet (two symmetric peaks) centered about 1.31 ppm, and a quartet (four peaks with relative peak heights of 1:2:2:1) centered about 4.10 ppm. The doublet at 1.31 ppm is typically quantified as the quartet may be suppressed through water saturation or obscured by residual water. In healthy subjects lactate is not visible, for its concentration is lower than the detection limit of MRS; however, presence of this peak indicates glycolysis has been initiated in an oxygen-deficient environment. Several causes of this include ischemia, hypoxia, mitochondrial disorders, and some types of tumors.
  6. Myo-inositol: with its major peak at 3.56 ppm, an increase in Myo-inositol has been seen to be disrupted in patients with Alzheimer's, dementia, and HIV patients.
  7. Glutamate and glutamine: these amino acids are marked by a series of resonance peaks between 2.2 and 2.4 ppm. Hyperammonemia, hepatic encephalopathy are two major conditions that result in elevated levels of glutamine and glutamate. MRS, used in conjunction with MRI or some other imaging technique, can be used to detect changes in the concentrations of these metabolites, or significantly abnormal concentrations of these metabolites.
  8. GABA can be detected primarily from its peaks at approximately 3.0 ppm, however because creatine has a strong singlet at 3.0 ppm with approximately 20x the amplitude a technique which exploits J-coupling must be used to accurately quantify GABA. The most common techniques for this are J-difference editing (MEGA), or J-resolved (as used in JPRESS)
  9. Glutathione can also be detected from its peak at peak at 3.0 ppm, however similar to GABA it also must use a method which exploits J-coupling to remove the overlaying creatine signal.

Limitations of MRS

The major limitation to MRS is its low available signal due to the low concentration of metabolites as compared to water. As such, it has inherently poor temporal and spatial resolution. Nevertheless, no alternate technique is able to quantify metabolism in vivo non-invasively and thus MRS remains a valuable tool for research and clinical scientists.

In addition, despite recent efforts toward international expert consensus on methodological details like shimming, [20] motion correction, [21] spectral editing, [22] spectroscopic neuroimaging, [23] other advanced acquisition methods, [24] data processing and quantification, [25] application to brain, [26] proton spectroscopy application to skeletal muscle, [27] phosphorus application to skeletal muscle, [28] methods description, [29] results reporting, [30] and other considerations, currently published implementations of in vivo magnetic resonance spectroscopy cluster into literatures exhibiting a broad variety of individualized acquisition, processing, quantification, and reporting techniques. [31] This situation may contribute to a low sensitivity and specificity of, for example, in vivo proton magnetic resonance spectroscopy to disorders such as multiple sclerosis, that continue to fall below clinically beneficial thresholds for, e.g., diagnosis. [31]

Non-Proton (1H) MRS

31Phosphorus Magnetic Resonance Spectroscopy

1H MRS's clinical success is only rivaled by 31P MRS. This is in large part because of the relatively high sensitivity of phosphorus NMR (7% of protons) combined with a 100% natural abundance. [19] :90–93 Consequently, high-quality spectra are acquired within minutes. Even at low field strengths, great spectra resolution is obtained because of the relatively large (~30 ppm) chemical shift dispersion for in vivo phosphates. Clinically, phosphorus NMR excels because it detects all metabolites playing key roles in tissue energy metabolism and can indirectly deduce intracellular pH. However, phosphorus NMR is chiefly challenged by the limited number of metabolites it can detect. [19] :90–93

13Carbon Magnetic Resonance Spectroscopy

In contrast to phosphorus NMR, carbon NMR is an insensitive technique. This arises from the fact that 13C NMR has a low abundance (1.1%) and carbon's low gyromagnetic ratio. [19] :93–96 This low abundance is because 12C does not have a magnetic moment, making it not NMR active, leading to 13C's use for spectroscopy purposes. However, this low sensitivity can be improved via decoupling, averaging, polarization transfer, and larger volumes. [19] :93–96 Despite the low natural abundance and sensitivity of 13C, 13C MRS has been used to study several metabolites, especially glycogen and triglycerides. [19] :93–96 It has proven especially useful at providing insight on the metabolic fluxes from 13C-labeled precursors. [19] :93–96 There is great overlap in what 1H MRS and 13C MRS can obtain spectra-wise and large reason, combined with 1H MRS's high sensitivity, why 13C MRS has never seen wide application like 1H MRS. See also Hyperpolarized carbon-13 MRI.

23Sodium Magnetic Resonance Spectroscopy

Sodium NMR is infamous for its low sensitivity (9.2% relative to proton sensitivity) and low SNR because of its low sodium concentration (30 - 100 mM), especially compared to protons (40 - 50 M). [19] :96–102 However, interest in sodium NMR has been reinspired by recent significant gains in SNR at high magnetic fields, along with improved coil designs and optimized pulse sequences. There is much hope for sodium NMR's clinical potential because the detection of abnormal intracellular sodium in vivo may have significant diagnostic potential and reveal new insights into tissue electrolysis homeostasis. [19] :96–102

19Fluorine Magnetic Resonance Spectroscopy

Fluorine NMR has high sensitivity (82% relative to proton sensitivity) and 100% natural abundance. [19] :102–104 However, it is important to note that no endogenous 19F containing compounds are found in biological tissues and thus the fluorine signal comes from an external reference compound. Because19F is not found in biological tissues, 19F does not have to deal with interference from background signals like in vivo 1H MRS does with water, making it especially powerful for pharmacokinetic studies. 1H MRI provides the anatomical landmarks, while 19F MRI/MRS allows us to follow and map the specific interactions of specific compounds. [19] :102–104 in vivo 19F MRS can be used to monitor the uptake and metabolism of drugs, study the metabolism of anesthetic, determine cerebral blood flow, and measure, via fluorinated compounds ("probes"), various parameters like pH, oxygen levels, and metal concentration. [19] :102–104

See also

Related Research Articles

<span class="mw-page-title-main">Magnetic resonance imaging</span> Medical imaging technique

Magnetic resonance imaging (MRI) is a medical imaging technique used in radiology to form pictures of the anatomy and the physiological processes of the body. MRI scanners use strong magnetic fields, magnetic field gradients, and radio waves to generate images of the organs in the body. MRI does not involve X-rays or the use of ionizing radiation, which distinguishes it from computed tomography (CT) and positron emission tomography (PET) scans. MRI is a medical application of nuclear magnetic resonance (NMR) which can also be used for imaging in other NMR applications, such as NMR spectroscopy.

In nuclear magnetic resonance (NMR) spectroscopy, the chemical shift is the resonant frequency of an atomic nucleus relative to a standard in a magnetic field. Often the position and number of chemical shifts are diagnostic of the structure of a molecule. Chemical shifts are also used to describe signals in other forms of spectroscopy such as photoemission spectroscopy.

<span class="mw-page-title-main">Nuclear magnetic resonance spectroscopy</span> Laboratory technique

Nuclear magnetic resonance spectroscopy, most commonly known as NMR spectroscopy or magnetic resonance spectroscopy (MRS), is a spectroscopic technique to observe local magnetic fields around atomic nuclei. This spectroscopy is based on the measurement of absorption of electromagnetic radiations in the radio frequency region from roughly 4 to 900 MHz. Absorption of radio waves in the presence of magnetic field is accompanied by a special type of nuclear transition, and for this reason, such type of spectroscopy is known as Nuclear Magnetic Resonance Spectroscopy. The sample is placed in a magnetic field and the NMR signal is produced by excitation of the nuclei sample with radio waves into nuclear magnetic resonance, which is detected with sensitive radio receivers. The intramolecular magnetic field around an atom in a molecule changes the resonance frequency, thus giving access to details of the electronic structure of a molecule and its individual functional groups. As the fields are unique or highly characteristic to individual compounds, in modern organic chemistry practice, NMR spectroscopy is the definitive method to identify monomolecular organic compounds.

Carbon-13 (C13) nuclear magnetic resonance is the application of nuclear magnetic resonance (NMR) spectroscopy to carbon. It is analogous to proton NMR and allows the identification of carbon atoms in an organic molecule just as proton NMR identifies hydrogen atoms. 13C NMR detects only the 13
C
isotope. The main carbon isotope, 12
C
does not produce an NMR signal. Although ca. 1 mln. times less sensitive than 1H NMR spectroscopy, 13C NMR spectroscopy is widely used for characterizing organic and organometallic compounds, primarily because 1H-decoupled 13C-NMR spectra are more simple, have a greater sensitivity to differences in the chemical structure, and, thus, are better suited for identifying molecules in complex mixtures. At the same time, such spectra lack quantitative information about the atomic ratios of different types of carbon nuclei, because nuclear Overhauser effect used in 1H-decoupled 13C-NMR spectroscopy enhances the signals from carbon atoms with a larger number of hydrogen atoms attached to them more than from carbon atoms with a smaller number of H's, and because full relaxation of 13C nuclei is usually not attained, and the nuclei with shorter relaxation times produce more intense signals.

<span class="mw-page-title-main">Proton nuclear magnetic resonance</span> NMR via protons, hydrogen-1 nuclei

Proton nuclear magnetic resonance is the application of nuclear magnetic resonance in NMR spectroscopy with respect to hydrogen-1 nuclei within the molecules of a substance, in order to determine the structure of its molecules. In samples where natural hydrogen (H) is used, practically all the hydrogen consists of the isotope 1H.

Nuclear magnetic resonance spectroscopy of proteins is a field of structural biology in which NMR spectroscopy is used to obtain information about the structure and dynamics of proteins, and also nucleic acids, and their complexes. The field was pioneered by Richard R. Ernst and Kurt Wüthrich at the ETH, and by Ad Bax, Marius Clore, Angela Gronenborn at the NIH, and Gerhard Wagner at Harvard University, among others. Structure determination by NMR spectroscopy usually consists of several phases, each using a separate set of highly specialized techniques. The sample is prepared, measurements are made, interpretive approaches are applied, and a structure is calculated and validated.

The heteronuclear single quantum coherence or heteronuclear single quantum correlation experiment, normally abbreviated as HSQC, is used frequently in NMR spectroscopy of organic molecules and is of particular significance in the field of protein NMR. The experiment was first described by Geoffrey Bodenhausen and D. J. Ruben in 1980. The resulting spectrum is two-dimensional (2D) with one axis for proton (1H) and the other for a heteronucleus, which is usually 13C or 15N. The spectrum contains a peak for each unique proton attached to the heteronucleus being considered. The 2D HSQC can also be combined with other experiments in higher-dimensional NMR experiments, such as NOESY-HSQC or TOCSY-HSQC.

Two-dimensional nuclear magnetic resonance spectroscopy is a set of nuclear magnetic resonance spectroscopy (NMR) methods which give data plotted in a space defined by two frequency axes rather than one. Types of 2D NMR include correlation spectroscopy (COSY), J-spectroscopy, exchange spectroscopy (EXSY), and nuclear Overhauser effect spectroscopy (NOESY). Two-dimensional NMR spectra provide more information about a molecule than one-dimensional NMR spectra and are especially useful in determining the structure of a molecule, particularly for molecules that are too complicated to work with using one-dimensional NMR.

Fast low angle shot magnetic resonance imaging is a particular sequence of magnetic resonance imaging. It is a gradient echo sequence which combines a low-flip angle radio-frequency excitation of the nuclear magnetic resonance signal with a short repetition time. It is the generic form of steady-state free precession imaging.

During nuclear magnetic resonance observations, spin–lattice relaxation is the mechanism by which the longitudinal component of the total nuclear magnetic moment vector (parallel to the constant magnetic field) exponentially relaxes from a higher energy, non-equilibrium state to thermodynamic equilibrium with its surroundings (the "lattice"). It is characterized by the spin–lattice relaxation time, a time constant known as T1.

Magnetization transfer (MT), in NMR and MRI, refers to the transfer of nuclear spin polarization and/or spin coherence from one population of nuclei to another population of nuclei, and to techniques that make use of these phenomena. There is some ambiguity regarding the precise definition of magnetization transfer, however the general definition given above encompasses all more specific notions. NMR active nuclei, those with non-zero spin, can be energetically coupled to one another under certain conditions. The mechanisms of nuclear-spin energy-coupling have been extensively characterized and are described in the following articles: Angular momentum coupling, Magnetic dipole–dipole interaction, J-coupling, Residual dipolar coupling, Nuclear Overhauser effect, Spin–spin relaxation, and Spin saturation transfer. Alternatively, some nuclei in a chemical system are labile and exchange between non-equivalent environments. A more specific example of this case is presented in the section Chemical Exchange Magnetization transfer.

<span class="mw-page-title-main">Nuclear magnetic resonance</span> Spectroscopic technique based on change of nuclear spin state

Nuclear magnetic resonance (NMR) is a physical phenomenon in which nuclei in a strong constant magnetic field are perturbed by a weak oscillating magnetic field and respond by producing an electromagnetic signal with a frequency characteristic of the magnetic field at the nucleus. This process occurs near resonance, when the oscillation frequency matches the intrinsic frequency of the nuclei, which depends on the strength of the static magnetic field, the chemical environment, and the magnetic properties of the isotope involved; in practical applications with static magnetic fields up to ca. 20 tesla, the frequency is similar to VHF and UHF television broadcasts (60–1000 MHz). NMR results from specific magnetic properties of certain atomic nuclei. Nuclear magnetic resonance spectroscopy is widely used to determine the structure of organic molecules in solution and study molecular physics and crystals as well as non-crystalline materials. NMR is also routinely used in advanced medical imaging techniques, such as in magnetic resonance imaging (MRI).

<span class="mw-page-title-main">Physics of magnetic resonance imaging</span> Overview article

The physics of magnetic resonance imaging (MRI) concerns fundamental physical considerations of MRI techniques and technological aspects of MRI devices. MRI is a medical imaging technique mostly used in radiology and nuclear medicine in order to investigate the anatomy and physiology of the body, and to detect pathologies including tumors, inflammation, neurological conditions such as stroke, disorders of muscles and joints, and abnormalities in the heart and blood vessels among others. Contrast agents may be injected intravenously or into a joint to enhance the image and facilitate diagnosis. Unlike CT and X-ray, MRI uses no ionizing radiation and is, therefore, a safe procedure suitable for diagnosis in children and repeated runs. Patients with specific non-ferromagnetic metal implants, cochlear implants, and cardiac pacemakers nowadays may also have an MRI in spite of effects of the strong magnetic fields. This does not apply on older devices, and details for medical professionals are provided by the device's manufacturer.

Functional magnetic resonance spectroscopy of the brain (fMRS) uses magnetic resonance imaging (MRI) to study brain metabolism during brain activation. The data generated by fMRS usually shows spectra of resonances, instead of a brain image, as with MRI. The area under peaks in the spectrum represents relative concentrations of metabolites.

<span class="mw-page-title-main">Perfusion MRI</span>

Perfusion MRI or perfusion-weighted imaging (PWI) is perfusion scanning by the use of a particular MRI sequence. The acquired data are then post-processed to obtain perfusion maps with different parameters, such as BV, BF, MTT and TTP.

Sodium MRI is a specialised magnetic resonance imaging technique that uses strong magnetic fields, magnetic field gradients, and radio waves to generate images of the distribution of sodium in the body, as opposed to more common forms of MRI that utilise protons present in water (1H-MRI). Like the proton, sodium is naturally abundant in the body, so can be imaged directly without the need for contrast agents or hyperpolarization. Furthermore, sodium ions play a role in important biological processes via their contribution to concentration and electrochemical gradients across cellular membranes, making it of interest as an imaging target in health and disease.

Hyperpolarized carbon-13 MRI is a functional medical imaging technique for probing perfusion and metabolism using injected substrates.

<span class="mw-page-title-main">MRI sequence</span>

An MRI sequence in magnetic resonance imaging (MRI) is a particular setting of pulse sequences and pulsed field gradients, resulting in a particular image appearance.

<span class="mw-page-title-main">Rolf Gruetter</span> Swiss physicist specialized in magnetic resonance

Rolf Gruetter is a Swiss physicist and neurobiologist specialized in magnetic resonance, biomedical imaging and brain metabolism. He is a professor of physics at EPFL and the head of the Laboratory Functional and Metabolic Imaging at the School of Basic Sciences.

Michael Albert Thomas is an Indian-American physicist, academic, and clinical researcher. He is a Professor-in-Residence of Radiological Sciences, and Psychiatry at the Geffen School of Medicine, University of California, Los Angeles (UCLA). He is most known for developing novel single voxel based 2D NMR techniques, multi-voxel 2D MRS techniques using hybrid Cartesian as well as non-Cartesian spatio-temporal encoding such as concentric ring, radial and rosette trajectories.

References

  1. Dappert A, Guenther RS, Peyrard S, eds. (1992). In-vivo magnetic resonance spectroscopy. Berlin: Springer-Verlag. ISBN   978-3-540-55029-7.
  2. Jansen JF, Backes WH, Nicolay K, Kooi ME (August 2006). "1H MR spectroscopy of the brain: absolute quantification of metabolites". Radiology. 240 (2): 318–32. doi:10.1148/radiol.2402050314. PMID   16864664.
  3. Preul MC, Caramanos Z, Collins DL, Villemure JG, Leblanc R, Olivier A, et al. (March 1996). "Accurate, noninvasive diagnosis of human brain tumors by using proton magnetic resonance spectroscopy". Nature Medicine. 2 (3): 323–5. doi:10.1038/nm0396-323. PMID   8612232. S2CID   30864588.
  4. Dong Z (April 2015). "Proton MRS and MRSI of the brain without water suppression". Progress in Nuclear Magnetic Resonance Spectroscopy. 86–87: 65–79. doi:10.1016/j.pnmrs.2014.12.001. PMID   25919199.
  5. 1 2 3 4 5 6 7 8 9 Landheer K, Schulte RF, Treacy MS, Swanberg KM, Juchem C (April 2020). "Theoretical description of modern 1 H in Vivo magnetic resonance spectroscopic pulse sequences". Journal of Magnetic Resonance Imaging. 51 (4): 1008–1029. doi:10.1002/jmri.26846. PMID   31273880. S2CID   195806833.
  6. Landheer, Karl; Swanberg, Kelley M.; Juchem, Christoph (May 2021). "Magnetic resonance Spectrum simulator (MARSS), a novel software package for fast and computationally efficient basis set simulation". NMR in Biomedicine. 34 (5): e4129. doi:10.1002/nbm.4129. PMID   31313877. S2CID   197421767.
  7. Simpson, Robin; Devenyi, Gabriel A.; Jezzard, Peter; Hennessy, T. Jay; Near, Jamie (January 2017). "Advanced processing and simulation of MRS data using the FID appliance ( FID‐A )—An open source, MATLAB ‐based toolkit". Magnetic Resonance in Medicine. 77 (1): 23–33. doi: 10.1002/mrm.26091 . PMID   26715192. S2CID   11172299.
  8. This is done by modeling the exact experimental details (pulse shapes, timings, gradients, etc.) into the software. https://spindynamics.org/
  9. de Graaf RA, Luo Y, Terpstra M, Garwood M (November 1995). "Spectral editing with adiabatic pulses". Journal of Magnetic Resonance, Series B. 109 (2): 184–93. Bibcode:1995JMRB..109..184D. doi:10.1006/jmrb.1995.0008. PMID   7582600.
  10. van der Graaf M (March 2010). "In vivo magnetic resonance spectroscopy: basic methodology and clinical applications". European Biophysics Journal. 39 (4): 527–40. doi:10.1007/s00249-009-0517-y. PMC   2841275 . PMID   19680645.
  11. Scheenen, Tom W. J.; Klomp, Dennis W. J.; Wijnen, Jannie P.; Heerschap, Arend (January 2008). "Short echo time1H-MRSI of the human brain at 3T with minimal chemical shift displacement errors using adiabatic refocusing pulses". Magnetic Resonance in Medicine. 59 (1): 1–6. doi: 10.1002/mrm.21302 . PMID   17969076. S2CID   34328651.
  12. Wilson, Martin; Andronesi, Ovidiu; Barker, Peter B.; Bartha, Robert; Bizzi, Alberto; Bolan, Patrick J.; Brindle, Kevin M.; Choi, In-Young; Cudalbu, Cristina; Dydak, Ulrike; Emir, Uzay E.; Gonzalez, Ramon G.; Gruber, Stephan; Gruetter, Rolf; Gupta, Rakesh K.; Heerschap, Arend; Henning, Anke; Hetherington, Hoby P.; Huppi, Petra S.; Hurd, Ralph E.; Kantarci, Kejal; Kauppinen, Risto A; Klomp, Dennis W. J.; Kreis, Roland; Kruiskamp, Marijn J.; Leach, Martin O.; Lin, Alexander P.; Luijten, Peter R.; Marjańska, Małgorzata; Maudsley, Andrew A.; Meyerhoff, Dieter J.; Mountford, Carolyn E.; Mullins, Paul G.; Murdoch, James B.; Nelson, Sarah J.; Noeske, Ralph; Öz, Gülin; Pan, Julie W.; Peet, Andrew C.; Poptani, Harish; Posse, Stefan; Ratai, Eva-Maria; Salibi, Nouha; Scheenen, Tom W. J.; Smith, Ian C. P.; Soher, Brian J.; Tkáč, Ivan; Vigneron, Daniel B.; Howe, Franklyn A. (August 2019). "A Methodological Consensus on Clinical Proton MR Spectroscopy of the Brain: Review and Recommendations". Magnetic Resonance in Medicine. 82 (2): 527–550. doi:10.1002/mrm.27742. PMC   7179569 . PMID   30919510.
  13. Landheer, Karl; Juchem, Christoph (April 2019). "Dephasing optimization through coherence order pathway selection (DOTCOPS) for improved crusher schemes in MR spectroscopy". Magnetic Resonance in Medicine. 81 (4): 2209–2222. doi:10.1002/mrm.27587. PMID   30390346. S2CID   53251119.
  14. Landheer, Karl; Juchem, Christoph (February 2020). "Simultaneous optimization of crusher and phase cycling schemes for magnetic resonance spectroscopy: an extension of dephasing optimization through coherence order pathway selection". Magnetic Resonance in Medicine. 83 (2): 391–402. doi:10.1002/mrm.27952. PMID   31529647. S2CID   202675464.
  15. Gujar SK, Maheshwari S, Björkman-Burtscher I, Sundgren PC (September 2005). "Magnetic resonance spectroscopy". Journal of Neuro-Ophthalmology. 25 (3): 217–26. doi: 10.1097/01.wno.0000177307.21081.81 . PMID   16148633.
  16. Fanelli A (2016). "Xenograft Models: In vivo imaging" . Retrieved 3 December 2017.
  17. Saini KS, Patel AL, Shaikh WA, Magar LN, Pungaonkar SA (August 2007). "Magnetic resonance spectroscopy in pituitary tuberculoma". Singapore Medical Journal. 48 (8): 783–6. PMID   17657390.
  18. Mueller-Lisse UG, Scherr M (June 2003). "[1H magnetic resonance spectroscopy of the prostate]" [1H magnetic resonance spectroscopy of the prostate]. Der Radiologe (in German). 43 (6): 481–8. doi:10.1007/s00117-003-0902-y. PMID   12827263. S2CID   45663226.
  19. 1 2 3 4 5 6 7 8 9 10 11 12 13 14 15 16 17 18 19 20 21 22 23 24 25 26 27 28 29 30 31 32 33 34 35 36 37 38 39 40 41 42 43 44 45 46 47 48 De Graaf RA (2019). In Vivo NMR Spectroscopy: Principles and Techniques (Third ed.). Hoboken, NJ. ISBN   978-1-119-38254-6.{{cite book}}: CS1 maint: location missing publisher (link)
  20. Juchem C, Cudalbu C, de Graaf RA, Gruetter R, Henning A, Hetherington HP, Boer VO (June 2020). "B0 shimming for in vivo magnetic resonance spectroscopy: Experts' consensus recommendations". NMR in Biomedicine. 34 (5): e4350. doi:10.1002/nbm.4350. PMID   32596978. S2CID   220253842.
  21. Andronesi OC, Bhattacharyya PK, Bogner W, Choi IY, Hess AT, Lee P, et al. (July 2020). "Motion correction methods for MRS: experts' consensus recommendations". NMR in Biomedicine. 34 (5): e4364. doi:10.1002/nbm.4364. ISSN   0952-3480. PMC   7855523 . PMID   33089547.
  22. Choi IY, Andronesi OC, Barker P, Bogner W, Edden RA, Kaiser LG, et al. (September 2020). "Spectral editing in 1 H magnetic resonance spectroscopy: Experts' consensus recommendations". NMR in Biomedicine. 34 (5): e4411. doi:10.1002/nbm.4411. PMC   8557623 . PMID   32946145. S2CID   221786562.
  23. Maudsley AA, Andronesi OC, Barker PB, Bizzi A, Bogner W, Henning A, et al. (April 2020). "Advanced magnetic resonance spectroscopic neuroimaging: Experts' consensus recommendations". NMR in Biomedicine. 34 (5): e4309. doi:10.1002/nbm.4309. PMC   7606742 . PMID   32350978.
  24. Öz G, Deelchand DK, Wijnen JP, Mlynárik V, Xin L, Mekle R, et al. (January 2020). "Advanced single voxel 1 H magnetic resonance spectroscopy techniques in humans: Experts' consensus recommendations". NMR in Biomedicine. 34 (5): e4236. doi:10.1002/nbm.4236. PMC   7347431 . PMID   31922301.
  25. Near J, Harris AD, Juchem C, Kreis R, Marjańska M, Öz G, et al. (February 2020). "Preprocessing, analysis and quantification in single-voxel magnetic resonance spectroscopy: experts' consensus recommendations". NMR in Biomedicine. 34 (5): e4257. doi:10.1002/nbm.4257. PMC   7442593 . PMID   32084297.
  26. Wilson M, Andronesi O, Barker PB, Bartha R, Bizzi A, Bolan PJ, et al. (August 2019). "Methodological consensus on clinical proton MRS of the brain: Review and recommendations". Magnetic Resonance in Medicine. 82 (2): 527–550. doi:10.1002/mrm.27742. PMC   7179569 . PMID   30919510.
  27. Krššák M, Lindeboom L, Schrauwen-Hinderling V, Szczepaniak LS, Derave W, Lundbom J, et al. (February 2020). "Proton magnetic resonance spectroscopy in skeletal muscle: Experts' consensus recommendations". NMR in Biomedicine. 34 (5): e4266. doi: 10.1002/nbm.4266 . PMC   8244035 . PMID   32022964.
  28. Meyerspeer M, Boesch C, Cameron D, Dezortová M, Forbes SC, Heerschap A, et al. (February 2020). "31 P magnetic resonance spectroscopy in skeletal muscle: Experts' consensus recommendations". NMR in Biomedicine. 34 (5): e4246. doi: 10.1002/nbm.4246 . PMC   8243949 . PMID   32037688.
  29. Kreis R, Boer V, Choi IY, Cudalbu C, de Graaf RA, Gasparovic C, et al. (August 2020). "Terminology and concepts for the characterization of in vivo MR spectroscopy methods and MR spectra: Background and experts' consensus recommendations". NMR in Biomedicine. 34 (5): e4347. doi:10.1002/nbm.4347. PMC   7887137 . PMID   32808407.
  30. Lin A, Andronesi O, Bogner W, Choi IY, Coello E, Cudalbu C, et al. (February 2021). "Minimum Reporting Standards for in vivo Magnetic Resonance Spectroscopy (MRSinMRS): Experts' consensus recommendations". NMR in Biomedicine. 34 (5): e4484. doi: 10.1002/nbm.4484 . PMC   8647919 . PMID   33559967.
  31. 1 2 Swanberg KM, Landheer K, Pitt D, Juchem C (2019). "Quantifying the Metabolic Signature of Multiple Sclerosis by in vivo Proton Magnetic Resonance Spectroscopy: Current Challenges and Future Outlook in the Translation From Proton Signal to Diagnostic Biomarker". Frontiers in Neurology. 10: 1173. doi: 10.3389/fneur.2019.01173 . PMC   6876616 . PMID   31803127.