This article is about the class of sweet-flavored substances used as food. For common table sugar, see Sucrose. For other uses, see Sugar (disambiguation).
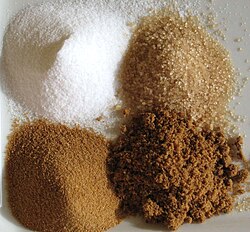
Sugars (clockwise from top-left): white refined, unrefined, brown, unprocessed cane sugar
Sugar is the generic name for sweet-tasting, soluble carbohydrates, many of which are used in food. Simple sugars, also called monosaccharides, include glucose, fructose, and galactose. Compound sugars, also called disaccharides or double sugars, are molecules made of two bonded monosaccharides; common examples are sucrose (glucose + fructose), lactose (glucose + galactose), and maltose (two molecules of glucose). White sugar is almost pure sucrose. During digestion, compound sugars are hydrolysed into simple sugars.
Longer chains of saccharides are not regarded as sugars, and are called oligosaccharides or polysaccharides. Starch is a glucose polymer found in plants – the most abundant source of energy in human food. Some other chemical substances, such as ethylene glycol, glycerol and sugar alcohols, may have a sweet taste, but are not classified as sugar.
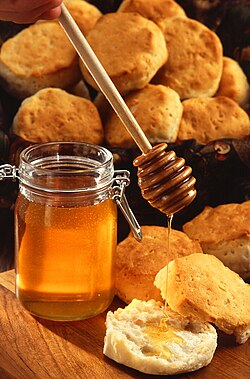
Sugars are found in the tissues of most plants. Honey and fruits are abundant natural sources of simple sugars. Sucrose is especially concentrated in sugarcane and sugar beet, making them efficient for commercial extraction to make refined sugar. In 2016, the combined world production of those two crops was about two billion tonnes. Maltose may be produced by malting grain. Lactose is the only sugar that cannot be extracted from plants, as it occurs only in milk, including human breast milk, and in some dairy products. A cheap source of sugar is corn syrup, industrially produced by converting corn starch into sugars, such as maltose, fructose and glucose.
Sucrose is used in prepared foods (e.g., cookies and cakes), is sometimes added to commercially available ultra-processed food and beverages, and is sometimes used as a sweetener for foods (e.g., toast and cereal) and beverages (e.g., coffee and tea). Globally on average a person consumes about 24 kilograms (53 pounds) of sugar each year. North and South Americans consume up to 50kg (110lb), and Africans consume under 20kg (44lb).[1]
The use of added sugar in food and beverage manufacturing is a concern for elevated calorie intake, which is associated with an increased risk of several diseases, such as obesity, diabetes, and cardiovascular disorders.[2] In 2015, the World Health Organization recommended that adults and children reduce their intake of free sugars to less than 10% of their total energy intake, encouraging a reduction to below 5%.[3]
Etymology
The etymology of sugar reflects the commodity's spread. From Sanskritśarkarā, meaning "ground or candied sugar", came Persianshakar and Arabic sukkar. The Arabic word was borrowed in Medieval Latin as succarum, whence came the 12th century Frenchsucre and the English sugar. Sugar was introduced into Europe by the Arabs in Sicily and Spain.[4]
The English word jaggery, a coarse brown sugar made from date palm sap or sugarcane juice, has a similar etymological origin: Portuguese jágara from the Malayalam cakkarā, which is from the Sanskrit śarkarā.[5]
Sugar was first produced from sugar cane in the Indian subcontinent.[6] Diverse species of sugar cane seem to have originated from India (Saccharum barberi and S. edule) and New Guinea (S. officinarum).[7][8] Sugarcane is described in Chinese manuscripts dating to the 8th century BCE, which state that the use of sugarcane originated in India.[9]
Beet sugar, the starting point for the modern sugar industry,[12] was a German invention.[13][14] Beet sugar was first produced industrially in 1801 in Cunern, Prussia.[14]
Sugar became a household item by the 19th century, and this evolution of taste and demand for sugar as an essential food ingredient resulted in major economic and social changes.[15][pageneeded] Demand drove, in part, the colonisation and industrialisation of previously under-developed lands. It was also intimately associated with slavery.[15][pageneeded] World consumption increased more than 100 times from 1850 to 2000, led by the United Kingdom, where it increased from about 2 pounds per head per year in 1650 to 90 pounds by the early 20th century.
Scientifically, sugar loosely refers to a number of compounds typically with the formula (CH2O)n. Some large classes of sugars, ranked in increasing order of molecular weight are monosaccharides, disaccharides, or oligosaccharides.
Monosaccharides are also called "simple sugars", the most important being glucose. Most monosaccharides have a formula that conforms to C nH 2nO n with n between 3 and 7 (deoxyribose being an exception). Glucose has the molecular formulaC 6H 12O 6. The names of typical sugars end with -ose, as in "glucose" and "fructose". Such labels may also refer to any types of these compounds. Fructose, galactose, and glucose are all simple sugars, monosaccharides, with the general formula C6H12O6. They have five hydroxyl groups (−OH) and a carbonyl group (C=O) and are cyclic when dissolved in water. They each exist as several isomers with dextro- and laevo-rotatory forms that cause polarized light to diverge to the right or the left.[16]
Fructose, or fruit sugar, occurs naturally in fruits, some root vegetables, cane sugar and honey and is the sweetest of the sugars. It is one of the components of sucrose or table sugar. It is used as a high-fructose syrup, which is manufactured from hydrolyzed corn starch that has been processed to yield corn syrup, with enzymes then added to convert part of the glucose into fructose.[17]
Galactose generally does not occur in the free state but is a constituent with glucose of the disaccharide lactose or milk sugar. It is less sweet than glucose. It is a component of the antigens found on the surface of red blood cells that determine blood groups.[18]
Glucose occurs naturally in fruits and plant juices and is the primary product of photosynthesis. Starch is converted into glucose during digestion, and glucose is the form of sugar that is transported around the bodies of animals in the bloodstream. Although in principle there are two enantiomers of glucose (mirror images one of the other), naturally occurring glucose is D-glucose. This is also called dextrose, or grape sugar because drying grape juice produces crystals of dextrose that can be sieved from the other components.[19]
The acyclic monosaccharides (and disaccharides) contain either aldehyde groups or ketone groups. These carbon-oxygen double bonds (C=O) are the reactive centers. All saccharides with more than one ring in their structure result from two or more monosaccharides joined by glycosidic bonds with the resultant loss of a molecule of water (H 2O) per bond.[20]
Lactose, maltose, and sucrose are disaccharides, also called "compound sugars". The share the formula C12H22O11. They are formed by the condensation of two monosaccharide molecules with the expulsion of a molecule of water.[16]
Lactose is the naturally occurring sugar found in milk. A molecule of lactose is formed by the combination of a molecule of galactose with a molecule of glucose. It is broken down when consumed into its constituent parts by the enzyme lactase during digestion. Children have this enzyme but some adults no longer form it and they are unable to digest lactose.[21]
Maltose is formed during the germination of certain grains, the most notable being barley, which is converted into malt, the source of the sugar's name. A molecule of maltose is formed by the combination of two molecules of glucose. It is less sweet than glucose, fructose or sucrose.[16] It is formed in the body during the digestion of starch by the enzyme amylase and is itself broken down during digestion by the enzyme maltase.[22]
Sucrose is found in the stems of sugarcane and roots of sugar beet. It also occurs naturally alongside fructose and glucose in other plants, in particular fruits and some roots such as carrots. The different proportions of sugars found in these foods determines the range of sweetness experienced when eating them.[16] A molecule of sucrose is formed by the combination of a molecule of glucose with a molecule of fructose. After being eaten, sucrose is split into its constituent parts during digestion by a number of enzymes known as sucrases.[23]
Longer than disaccharides are oligosaccharides and polysaccharides. Cellulose and chitin are polymers, often crystalline, found in diverse plants and insects, respectively. Cellulose cannot be digested directly by animals. Starch is an amorphous polymer of glucose that is found in many plants and is widely used in the sugar industry.
Sources
The sugar contents of common fruits and vegetables are presented in Table 1.
Table 1. Sugar content of selected common plant foods (g/100g)[24]
^A The carbohydrate figure is calculated in the USDA database and does not always correspond to the sum of the sugars, the starch, and the dietary fiber.[why?]
^B The fructose to fructose plus glucose ratio is calculated by including the fructose and glucose coming from the sucrose.
Due to rising demand, sugar production in general increased some 14% over the period 2009 to 2018.[25] The largest importers were China, Indonesia, and the United States.[25]
Sugar
In 2022–2023 world production of sugar was 186 million tonnes, and in 2023–2024 an estimated 194 million tonnes — a surplus of 5 million tonnes, according to Ragus.[26]
Sugar cane accounted for around 21% of the global crop production over the 2000–2021 period. The Americas was the leading region in the production of sugar cane (52% of the world total).[28] Global production of sugarcane in 2022 was 1.9billion tonnes, with Brazil producing 38% of the world total and India 23% (table).
Sugarcane is any of several species, or their hybrids, of giant grasses in the genus Saccharum in the family Poaceae. They have been cultivated in tropical climates in the Indian subcontinent and Southeast Asia over centuries for the sucrose found in their stems.[6]
World production of raw sugar, main producers
Sugar cane requires a frost-free climate with sufficient rainfall during the growing season to make full use of the plant's substantial growth potential. The crop is harvested mechanically or by hand, chopped into lengths and conveyed rapidly to the processing plant (commonly known as a sugar mill) where it is either milled and the juice extracted with water or extracted by diffusion.[30] The juice is clarified with lime and heated to destroy enzymes. The resulting thin syrup is concentrated in a series of evaporators, after which further water is removed. The resulting supersaturated solution is seeded with sugar crystals, facilitating crystal formation and drying.[30]Molasses is a by-product of the process and the fiber from the stems, known as bagasse,[30] is burned to provide energy for the sugar extraction process. The crystals of raw sugar have a sticky brown coating and either can be used as they are, can be bleached by sulfur dioxide, or can be treated in a carbonatation process to produce a whiter product.[30] About 2,500 litres (660USgal) of irrigation water is needed for every one kilogram (2.2 pounds) of sugar produced.[31]
In 2022, global production of sugar beets was 260 million tonnes, led by Russia with 18.8% of the world total (table).
Sugar beet became a major source of sugar in the 19th century when methods for extracting the sugar became available. It is a biennial plant,[32] a cultivated variety of Beta vulgaris in the familyAmaranthaceae, the tuberous root of which contains a high proportion of sucrose. It is cultivated as a root crop in temperate regions with adequate rainfall and requires a fertile soil. The crop is harvested mechanically in the autumn and the crown of leaves and excess soil removed. The roots do not deteriorate rapidly and may be left in the field for some weeks before being transported to the processing plant where the crop is washed and sliced, and the sugar extracted by diffusion.[33]Milk of lime is added to the raw juice with calcium carbonate. After water is evaporated by boiling the syrup under a vacuum, the syrup is cooled and seeded with sugar crystals. The white sugar that crystallizes can be separated in a centrifuge and dried, requiring no further refining.[33]
Refined sugar is made from raw sugar that has undergone a refining process to remove the molasses.[34][35] Raw sugar is sucrose which is extracted from sugarcane or sugar beet. While raw sugar can be consumed, the refining process removes unwanted tastes and results in refined sugar or white sugar.[36][37]
The sugar may be transported in bulk to the country where it will be used and the refining process often takes place there. The first stage is known as affination and involves immersing the sugar crystals in a concentrated syrup that softens and removes the sticky brown coating without dissolving them. The crystals are then separated from the liquor and dissolved in water. The resulting syrup is treated either by a carbonatation or by a phosphatation process. Both involve the precipitation of a fine solid in the syrup and when this is filtered out, many of the impurities are removed at the same time. Removal of color is achieved by using either a granular activated carbon or an ion-exchange resin. The sugar syrup is concentrated by boiling and then cooled and seeded with sugar crystals, causing the sugar to crystallize out. The liquor is spun off in a centrifuge and the white crystals are dried in hot air and ready to be packaged or used. The surplus liquor is made into refiners' molasses.[38]
Refined sugar is widely used for industrial needs for higher quality. Refined sugar is purer (ICUMSA below 300) than raw sugar (ICUMSA over 1,500).[40] The level of purity associated with the colors of sugar, expressed by standard number ICUMSA, the smaller ICUMSA numbers indicate the higher purity of sugar.[40]
Coarse-grain sugar, also known as sanding sugar, composed of reflective crystals with grain size of about 1 to 3mm, similar to kitchen salt. Used atop baked products and candies, it will not dissolve when subjected to heat and moisture.[41]
Granulated sugar (about 0.6mm crystals), also known as table sugar or regular sugar, is used at the table, to sprinkle on foods and to sweeten hot drinks (coffee and tea), and in home baking to add sweetness and texture to baked products (cookies and cakes) and desserts (pudding and ice cream). It is also used as a preservative to prevent micro-organisms from growing and perishable food from spoiling, as in candied fruits, jams, and marmalades.[42]
Milled sugars such as powdered sugar (icing sugar) are ground to a fine powder. They are used for dusting foods and in baking and confectionery.[43][41]
Screened sugars such as caster sugar are crystalline products separated according to the size of the grains. They are used for decorative table sugars, for blending in dry mixes and in baking and confectionery.[43]
Densities
The densities of culinary sugars varies owing to differences in particle size and inclusion of moisture:[44]
Beet sugar 0.80 g/mL
Dextrose sugar 0.62 g/mL ( = 620kg/m^3)
Granulated sugar 0.70 g/mL
Powdered sugar 0.56 g/mL
Shapes
Sugar cubes
Cube sugar (sometimes called sugar lumps) are white or brown granulated sugars lightly steamed and pressed together in block shape. They are used to sweeten drinks.[43]
Sugarloaf was the usual cone-form in which refined sugar was produced and sold until the late 19th century.[45]
Brown sugar examples: Muscovado (top), dark brown (left), light brown (right)
Brown sugars are granulated sugars, either containing residual molasses, or with the grains deliberately coated with molasses to produce a light- or dark-colored sugar such as muscovado and turbinado. They are used in baked goods, confectionery, and toffees.[43] Their darkness is due to the amount of molasses they contain. They may be classified based on their darkness or country of origin.[41]
Glucose syrup and corn syrup are widely used in the manufacture of foodstuffs. They manufactured from starch by enzymatic hydrolysis.[46] For example, corn syrup, which is produced commercially by breaking down maize starch, is one common source of purified dextrose.[47] Such syrups are use in producing beverages, hard candy, ice cream, and jams.[43]
Inverted sugar syrup, commonly known as invert syrup or invert sugar, is a mixture of two simple sugars—glucose and fructose—that is made by heating granulated sugar in water. It is used in breads, cakes, and beverages for adjusting sweetness, aiding moisture retention and avoiding crystallization of sugars.[43]
Molasses and treacle are obtained by removing sugar from sugarcane or sugar beet juice, as a byproduct of sugar production. They may be blended with the above-mentioned syrups to enhance sweetness and used in a range of baked goods and confectionery including toffees and licorice.[43]
In winemaking, fruit sugars are converted into alcohol by a fermentation process. If the must formed by pressing the fruit has a low sugar content, additional sugar may be added to raise the alcohol content of the wine in a process called chaptalization. In the production of sweet wines, fermentation may be halted before it has run its full course, leaving behind some residual sugar that gives the wine its sweet taste.[48]
Because sugars burn easily when exposed to flame, the handling of sugar powders risks dust explosion.[50] The 2008 Georgia sugar refinery explosion, which killed 14 people and injured 36, and destroyed most of the refinery, was caused by the ignition of sugar dust.[51]
Low-calorie sweeteners are often made of maltodextrin with added sweeteners. Maltodextrin is an easily digestible synthetic polysaccharide consisting of short chains of three or more glucose molecules and is made by the partial hydrolysis of starch.[52] Strictly, maltodextrin is not classified as sugar as it contains more than two glucose molecules, although its structure is similar to maltose, a molecule composed of two joined glucose molecules.
Polyols are sugar alcohols and are used in chewing gums where a sweet flavor is required that lasts for a prolonged time in the mouth.[53]
Consumption
Worldwide sugar provides 10% of the daily calories (based on a 2000 kcal diet).[54] In 1750, the average Briton got 72 calories a day from sugar. In 1913, this had risen to 395. In 2015, sugar still provided around 14% of the calories in British diets.[55] According to one source, per capita consumption of sugar in 2016 was highest in the United States, followed by Germany and the Netherlands.[56]
Brown and white granulated sugar are 97% to nearly 100% carbohydrates, respectively, with less than 2% water, and no dietary fiber, protein or fat (table).[59] Because brown sugar contains 5–10% molasses reintroduced during processing, its value to some consumers is a richer flavor than white sugar.[60]
Health effects
The World Health Organization and other clinical associations recommend that reducing the consumption of free sugar (sugar sources added during manufacturing) to less than 10% of total energy needs can help to lower disease risk.[2][3] This amount of sugar consumption is equivalent to about 50g (1.8oz) or 12 teaspoons of added sugar per day.[61]As of 2025[update], the American Heart Association recommends that free sugar intake be limited to 6% of total daily energy needs, or 36g (1.3oz) (9 teaspoons) for adult males, and 25g (0.88oz) (6 teaspoons) for women.[62] In many countries, the source and amount of added sugars can be viewed among ingredients on the labels of packaged foods.[62] Added sugars provide no nutritional benefit, but are a source of excess calories that can lead to overweight and increased disease risk.[2][3][61][62]
A 2003 technical report by the World Health Organization provided evidence that high intake of sugary drinks (including fruit juice) increases the risk of obesity by adding to overall energy intake.[63] By itself, sugar is not a factor causing obesity and metabolic syndrome, but rather its excessive consumption adds to caloric burden, which meta-analyses showed could increase the risk of developing type 2 diabetes and metabolic syndrome in adults and children.[64][65]
Cancer
Sugar consumption does not directly cause cancer.[66][67][68]Cancer Council Australia have stated that "there is no evidence that consuming sugar makes cancer cells grow faster or cause cancer".[66] There is an indirect relationship between sugar consumption and obesity-related cancers through increased risk of excess body weight.[68][66][69]
There is a popular misconception that cancer can be treated by reducing sugar and carbohydrate intake to supposedly "starve" tumours. In reality, the health of people with cancer is best served by maintaining a healthy diet.[72]
Cognition
Despite some studies suggesting that sugar consumption causes hyperactivity, the quality of evidence is low[73] and it is generally accepted within the scientific community that the notion of children's 'sugar rush' is a myth.[74][75] A 2019 meta-analysis found that sugar consumption does not improve mood, but can lower alertness and increase fatigue within an hour of consumption.[76] One review of low-quality studies of children consuming high amounts of energy drinks showed association with higher rates of unhealthy behaviors, including smoking and excessive alcohol use, and with hyperactivity and insomnia, although such effects could not be specifically attributed to sugar over other components of those drinks such as caffeine.[77]
Tooth decay
The WHO, Action on Sugar and the Scientific Advisory Committee on Nutrition (SACN) state dental caries, also known as tooth decay/cavities, "can be prevented by avoiding dietary free sugars".[3][78][79][80]
A review of human studies showed that the incidence of caries is lower when sugar intake is less than 10% of total energy consumed.[81]Sugar-sweetened beverage consumption is associated with an increased risk of tooth decay.[82]
Nutritional displacement
The "empty calories" argument states that a diet high in added (or 'free') sugars will reduce consumption of foods that contain essential nutrients.[83] This nutrient displacement occurs if sugar makes up more than 25% of daily energy intake,[84] a proportion associated with poor diet quality and risk of obesity.[3] Displacement may occur at lower levels of consumption.[84]
Recommended dietary intake
The WHO recommends that both adults and children reduce the intake of free sugars to less than 10% of total energy intake.[3] "Free sugars" include monosaccharides and disaccharides added to foods, and sugars found in fruit juice and concentrates, as well as in honey and syrups.[3][62]
On 20 May 2016, the U.S. Food and Drug Administration announced changes to the Nutrition Facts panel displayed on all foods, to be effective by July 2018. New to the panel is a requirement to list "added sugars" by weight and as a percent of Daily Value (DV). For vitamins and minerals, the intent of DVs is to indicate how much should be consumed. For added sugars, the guidance is that 100% DV should not be exceeded. 100% DV is defined as 50 grams. For a person consuming 2000 calories a day, 50 grams is equal to 200 calories and thus 10% of total calories—the same guidance as the WHO.[85] To put this in context, most 12-US-fluid-ounce (355ml) cans of soda contain 39 grams of sugar. In the United States, a government survey on food consumption in 2013–2014 reported that, for men and women aged 20 and older, the average total sugar intakes—naturally occurring in foods and added—were, respectively, 125 and 99 grams per day.[86] The American Heart Association recommends even lower daily consumption of added sugars: 36 grams for men, and 25 grams for women.[62]
Society and culture
Manufacturers of sugary products, such as soft drinks and candy, and the Sugar Research Foundation have been accused of trying to influence consumers and medical associations in the 1960s and 1970s by creating doubt about the potential health hazards of sucrose overconsumption, while promoting saturated fat as the main dietary risk factor in cardiovascular diseases.[87] In 2016, the criticism led to recommendations that diet policymakers emphasize the need for high-quality research that accounts for multiple biomarkers on development of cardiovascular diseases.[87]
Originally, no sugar was white; anthropologist Sidney Mintz writes that white likely became understood as the ideal after groups who associated the color white with purity transferred their value to sugar.[88] In India, sugar frequently appears in religious observances. For ritual purity, such sugar cannot be white.[88]
↑Kiple KF, Kriemhild Conee Ornelas. World history of Food – Sugar. Cambridge University Press. Archived from the original on 23 January 2012. Retrieved 9 January 2012.{{cite book}}: CS1 maint: overridden setting (link)
↑Antonio Benítez Rojo (1996). The Repeating: The Caribbean and the Postmodern Perspective. James E. Maraniss (translation). Duke University Press. p.93. ISBN0-8223-1865-2.
↑Raven PH, George B. Johnson (1995). Carol J. Mills (ed.). Understanding Biology (3rded.). WM C. Brown. p.203. ISBN978-0-697-22213-8.
↑Teller GL (January 1918). "Sugars Other Than Cane or Beet". The American Food Journal: 23–24. Archived from the original on 15 April 2023. Retrieved 19 March 2023.
↑Pigman W, Horton, D. (1972). Pigman and Horton (ed.). The Carbohydrates: Chemistry and Biochemistry Vol 1A (2nded.). San Diego: Academic Press. pp.1–67. ISBN978-0-12-556352-9.
12"Sugar: World Markets and Trade"(PDF). Foreign Agricultural Service, US Department of Agriculture. November 2017. Archived(PDF) from the original on 23 November 2018. Retrieved 20 May 2018.
↑"Food Balance Sheets". Food and Agriculture Organization of the United Nations. 2007. Archived from the original on 9 October 2016. Retrieved 28 March 2012.
↑Otter C (2020). Diet for a large planet. USA: University of Chicago Press. p.22. ISBN978-0-226-69710-9.
↑Grimes DR, O'Riordan E (November 2023). "Starving cancer and other dangerous dietary misconceptions". Lancet Oncol. 24 (11): 1177–1178. doi:10.1016/S1470-2045(23)00483-7. PMID37922928.
↑Valenzuela MJ, Waterhouse B, Aggarwal VR, etal. (2021). "Effect of sugar-sweetened beverages on oral health: a systematic review and meta-analysis". Eur J Public Health. 31 (1): 122–129. doi:10.1093/eurpub/ckaa147. PMID32830237.
↑Marriott BP, Olsho L, Hadden L, etal. (2010). "Intake of added sugars and selected nutrients in the United States, National Health and Nutrition Examination Survey (NHANES) 2003–2006". Crit Rev Food Sci Nutr. 50 (3): 228–58. doi:10.1080/10408391003626223. PMID20301013. S2CID205689533.
12Panel on Macronutrients, Panel on the Definition of Dietary Fiber, Subcommittee on Upper Reference Levels of Nutrients, etal. (2005). Dietary reference intakes for energy, carbohydrate, fiber, fat, fatty acids, cholesterol, protein, and amino acids. Washington, DC: National Academies Press. ISBN978-0-309-08525-0. Retrieved 4 December 2018. Although there were insufficient data to set a UL [Tolerable Upper Intake Levels] for added sugars, a maximal intake level of 25 percent or less of energy is suggested to prevent the displacement of foods that are major sources of essential micronutrients
This page is based on this Wikipedia article Text is available under the CC BY-SA 4.0 license; additional terms may apply. Images, videos and audio are available under their respective licenses.