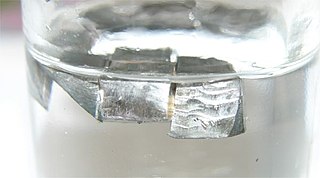
The alkali metals consist of the chemical elements lithium (Li), sodium (Na), potassium (K), rubidium (Rb), caesium (Cs), and francium (Fr). Together with hydrogen they constitute group 1, which lies in the s-block of the periodic table. All alkali metals have their outermost electron in an s-orbital: this shared electron configuration results in their having very similar characteristic properties. Indeed, the alkali metals provide the best example of group trends in properties in the periodic table, with elements exhibiting well-characterised homologous behaviour. This family of elements is also known as the lithium family after its leading element.
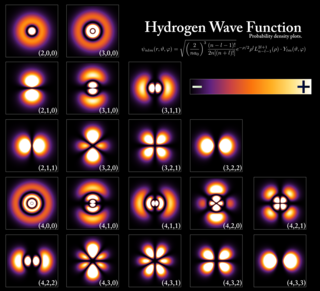
In quantum mechanics, an atomic orbital is a function describing the location and wave-like behavior of an electron in an atom. This function describes an electron's charge distribution around the atom's nucleus, and can be used to calculate the probability of finding an electron in a specific region around the nucleus.

In atomic physics, the Bohr model or Rutherford–Bohr model was the first successful model of the atom. Developed from 1911 to 1918 by Niels Bohr and building on Ernest Rutherford's nuclear model, it supplanted the plum pudding model of J J Thomson only to be replaced by the quantum atomic model in the 1920s. It consists of a small, dense nucleus surrounded by orbiting electrons. It is analogous to the structure of the Solar System, but with attraction provided by electrostatic force rather than gravity, and with the electron energies quantized.

A quantum mechanical system or particle that is bound—that is, confined spatially—can only take on certain discrete values of energy, called energy levels. This contrasts with classical particles, which can have any amount of energy. The term is commonly used for the energy levels of the electrons in atoms, ions, or molecules, which are bound by the electric field of the nucleus, but can also refer to energy levels of nuclei or vibrational or rotational energy levels in molecules. The energy spectrum of a system with such discrete energy levels is said to be quantized.

In physics and chemistry, ionization energy (IE) is the minimum energy required to remove the most loosely bound electron of an isolated gaseous atom, positive ion, or molecule. The first ionization energy is quantitatively expressed as

In atomic physics and quantum chemistry, the electron configuration is the distribution of electrons of an atom or molecule in atomic or molecular orbitals. For example, the electron configuration of the neon atom is 1s2 2s2 2p6, meaning that the 1s, 2s, and 2p subshells are occupied by two, two, and six electrons, respectively.
In spectroscopy, the Rydberg constant, symbol for heavy atoms or for hydrogen, named after the Swedish physicist Johannes Rydberg, is a physical constant relating to the electromagnetic spectra of an atom. The constant first arose as an empirical fitting parameter in the Rydberg formula for the hydrogen spectral series, but Niels Bohr later showed that its value could be calculated from more fundamental constants according to his model of the atom.
In atomic physics, the Rydberg formula calculates the wavelengths of a spectral line in many chemical elements. The formula was primarily presented as a generalization of the Balmer series for all atomic electron transitions of hydrogen. It was first empirically stated in 1888 by the Swedish physicist Johannes Rydberg, then theoretically by Niels Bohr in 1913, who used a primitive form of quantum mechanics. The formula directly generalizes the equations used to calculate the wavelengths of the hydrogen spectral series.
In physics and chemistry, the Lyman series is a hydrogen spectral series of transitions and resulting ultraviolet emission lines of the hydrogen atom as an electron goes from n ≥ 2 to n = 1, the lowest energy level of the electron (groundstate). The transitions are named sequentially by Greek letters: from n = 2 to n = 1 is called Lyman-alpha, 3 to 1 is Lyman-beta, 4 to 1 is Lyman-gamma, and so on. The series is named after its discoverer, Theodore Lyman. The greater the difference in the principal quantum numbers, the higher the energy of the electromagnetic emission.
Relativistic quantum chemistry combines relativistic mechanics with quantum chemistry to calculate elemental properties and structure, especially for the heavier elements of the periodic table. A prominent example is an explanation for the color of gold: due to relativistic effects, it is not silvery like most other metals.
In atomic physics, a term symbol is an abbreviated description of the total spin and orbital angular momentum quantum numbers of the electrons in a multi-electron atom. So while the word symbol suggests otherwise, it represents an actual value of a physical quantity.
A Rydberg atom is an excited atom with one or more electrons that have a very high principal quantum number, n. The higher the value of n, the farther the electron is from the nucleus, on average. Rydberg atoms have a number of peculiar properties including an exaggerated response to electric and magnetic fields, long decay periods and electron wavefunctions that approximate, under some conditions, classical orbits of electrons about the nuclei. The core electrons shield the outer electron from the electric field of the nucleus such that, from a distance, the electric potential looks identical to that experienced by the electron in a hydrogen atom.

In atomic physics and quantum chemistry, the Aufbau principle, also called the Aufbau rule, states that in the ground state of an atom or ion, electrons first fill subshells of the lowest available energy, then fill subshells of higher energy. For example, the 1s subshell is filled before the 2s subshell is occupied. In this way, the electrons of an atom or ion form the most stable electron configuration possible. An example is the configuration 1s2 2s2 2p6 3s2 3p3 for the phosphorus atom, meaning that the 1s subshell has 2 electrons, the 2s subshell has 2 electrons, the 2p subshell has 6 electrons, and so on.
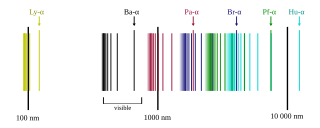
The emission spectrum of atomic hydrogen has been divided into a number of spectral series, with wavelengths given by the Rydberg formula. These observed spectral lines are due to the electron making transitions between two energy levels in an atom. The classification of the series by the Rydberg formula was important in the development of quantum mechanics. The spectral series are important in astronomical spectroscopy for detecting the presence of hydrogen and calculating red shifts.
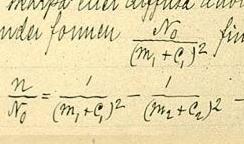
The Rydberg–Ritz combination principle is an empirical rule proposed by Walther Ritz in 1908 to describe the relationship of the spectral lines for all atoms, as a generalization of an earlier rule by Johannes Rydberg for the hydrogen atom and the alkali metals. The principle states that the spectral lines of any element include frequencies that are either the sum or the difference of the frequencies of two other lines. Lines of the spectra of elements could be predicted from existing lines. Since the frequency of light is proportional to the wavenumber or reciprocal wavelength, the principle can also be expressed in terms of wavenumbers which are the sum or difference of wavenumbers of two other lines.
A spin exchange relaxation-free (SERF) magnetometer is a type of magnetometer developed at Princeton University in the early 2000s. SERF magnetometers measure magnetic fields by using lasers to detect the interaction between alkali metal atoms in a vapor and the magnetic field.
The Pickering series (also known as the Pickering–Fowler series) consists of three lines of singly ionised helium found, usually in absorption, in the spectra of hot stars like Wolf–Rayet stars. The name comes from Edward Charles Pickering and Alfred Fowler. The lines are produced by transitions from a higher energy level of an electron to a level with principal quantum number n = 4. The lines have wavelengths:

The diffuse series is a series of spectral lines in the atomic emission spectrum caused when electrons jump between the lowest p orbital and d orbitals of an atom. The total orbital angular momentum changes between 1 and 2. The spectral lines include some in the visible light, and may extend into ultraviolet or near infrared. The lines get closer and closer together as the frequency increases never exceeding the series limit. The diffuse series was important in the development of the understanding of electron shells and subshells in atoms. The diffuse series has given the letter d to the d atomic orbital or subshell.
The fundamental series is a set of spectral lines in a set caused by transition between d and f orbitals in atoms.
In atomic emission spectroscopy, the principal series is a series of spectral lines caused when electrons move between p orbitals of an atom and the lowest available s orbital. These lines are usually found in the visible and ultraviolet portions of the electromagnetic spectrum. The principal series has given the letter p to the p atomic orbital and subshell.


