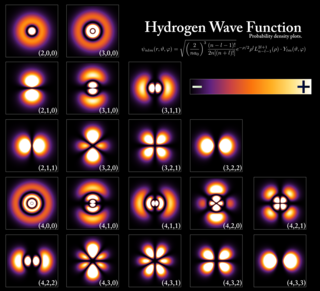
Diffuse series

Last updated

The diffuse series is a series of spectral lines in the atomic emission spectrum caused when electrons jump between the lowest p orbital and d orbitals of an atom. The total orbital angular momentum changes between 1 and 2. The spectral lines include some in the visible light, and may extend into ultraviolet or near infrared. The lines get closer and closer together as the frequency increases never exceeding the series limit. The diffuse series was important in the development of the understanding of electron shells and subshells in atoms. The diffuse series has given the letter d to the d atomic orbital or subshell.

Contents

The diffuse series has values given by

Grotrian diagram for sodium. The diffuse series is due to the 3p-nd transitions shown here in blue. Energy levels of sodium atom.png
Grotrian diagram for sodium. The diffuse series is due to the 3p-nd transitions shown here in blue.

The series is caused by transitions from the lowest P state to higher energy D orbitals. One terminology to identify the lines is: 1P-mD [1] But note that 1P just means the lowest P state in the valence shell of an atom and that the modern designation would start at 2P, and is larger for higher atomic numbered atoms.

The terms can have different designations, mD for single line systems, mδ for doublets and md for triplets. [2]

Since the Electron in the D subshell state is not the lowest energy level for the alkali atom (the S is) the diffuse series will not show up as absorption in a cool gas, however it shows up as emission lines. The Rydberg correction is largest for the S term as the electron penetrates the inner core of electrons more.

The limit for the series corresponds to electron emission, where the electron has so much energy it escapes the atom. [3]

In alkali metals the P terms are split and . This causes the spectral lines to be doublets, with a constant spacing between the two parts of the double line. [4]

This splitting is called fine structure. The splitting is larger for atoms with higher atomic number. The splitting decreases towards the series limit. Another splitting occurs on the redder line of the doublet. This is because of splitting in the D level and . Splitting in the D level has a lesser amount than the P level, and it reduces as the series limit is approached. [5]

History

The diffuse series used to be called the first subordinate series, with the sharp series being the second subordinate, both being subordinate to (less intense than) the principal series. [2]

Laws for alkali metals

The diffuse series limit is the same as the sharp series limit. In the late 1800s these two were termed supplementary series.

Spectral lines of the diffuse series are split into three lines in what is called fine structure. These lines cause the overall line to look diffuse. The reason this happens is that both the P and D levels are split into two closely spaced energies. P is split into . D is split into . Only three of the possible four transitions can take place because the angular momentum change cannot have a magnitude greater than one. [6]

In 1896 Arthur Schuster stated his law: "If we subtract the frequency of the fundamental vibration from the convergence frequency of the principal series , we obtain the convergence frequency of the supplementary series". [7] But in the next issue of the journal he realised that Rydberg had published the idea a few months earlier. [8]

Rydberg Schuster Law: Using wave numbers, the difference between the diffuse and sharp series limits and principal series limit is the same as the first transition in the principal series.

This difference is the lowest P level. [9]

Runge's Law: Using wave numbers the difference between the diffuse series limit and fundamental series limit is the same as the first transition in the diffuse series.

This difference is the lowest D level energy. [9]

Lithium

Lithium has a diffuse series with diffuse lines averaged around 6103.53, 4603.0, 4132.3, 3915.0 and 3794.7 Å. [10]

Sodium

Graph showing wavelengths of the diffuse series of sodium plotted against N (inverse square) making assumptions of different starting point of n. Blue diamond starts with n=2, red square starts with n=3, green triangle starts with n=4, violet X starts with n=5. Only with starting n of 3 is a straight line achieved Sodium diffuse series with different origins.png
Graph showing wavelengths of the diffuse series of sodium plotted against N (inverse square) making assumptions of different starting point of n. Blue diamond starts with n=2, red square starts with n=3, green triangle starts with n=4, violet X starts with n=5. Only with starting n of 3 is a straight line achieved

The sodium diffuse series has wave numbers given by:

The sharp series has wave numbers given by:

when n tends to infinity the diffuse and sharp series end up with the same limit. [11]

sodium diffuse series [12]
transitionwavelength 1 Åwavelength 2 Åwavelength 3 Å
3P-3D8194.828183.268194.79
3P-4D5688.215682.635688.19
3P-5D4982.814978.544982.8
3P-6D4668.564664.814668.6
3P-7D4497.664494.184497.7
3P-8D4393.344390.034393.3
3P-9D4324.624321.404324.6
3P-10D4276.794273.644276.8
3P-11D4242.084238.994242.0
3P-12D4215
3P-13D4195

Potassium

potassium diffuse series [13]
transitionwavelength 1 Åwavelength 2 Åwavelength 3 Å
4P-3D11772.811690.211769.7
4P-4D6964.696936.276964.18
4P-5D5831.95812.25831.7
4P-6D5359.75343.15359.6
4P-7D5112.25097.25112.2
4P-8D4965.04950.84965.0
4P-9D4869.84856.14869.8
4P-10D4804.34791.04804.3
4P-11D4757.44744.44757.4

Alkaline earths

A diffuse series of triplet lines is designated by series letter d and formula 1p-md. The diffuse series of singlet lines has series letter S and formula 1P-mS. [3]

Helium

Helium is in the same category as alkaline earths with respect to spectroscopy, as it has two electrons in the S subshell as do the other alkaline earths. Helium has a diffuse series of doublet lines with wavelengths 5876, 4472 and 4026 Å. Helium when ionised is termed HeII and has a spectrum very similar to hydrogen but shifted to shorter wavelengths. This has a diffuse series as well with wavelengths at 6678, 4922 and 4388 Å. [14]

Magnesium

Magnesium has a diffuse series of triplets and a sharp series of singlets. [3]

Calcium

Calcium has a diffuse series of triplets and a sharp series of singlets. [15]

Strontium

With strontium vapour, the most prominent lines are from the diffuse series. [16]

Barium

Barium has a diffuse series running from infrared to ultraviolet with wavelengths at 25515.7, 23255.3, 22313.4; 5818.91, 5800.30, 5777.70; 4493.66, 4489.00; 4087.31, 4084.87; 3898.58, 3894.34; 3789.72, 3788.18; 3721.17, and 3720.85 Å [17]

History

At Cambridge University George Liveing and James Dewar set out to systematically measure spectra of elements from groups I, II and III in visible light and longer wave ultraviolet that would transmit through air. They noticed that lines for sodium were alternating sharp and diffuse. They were the first to use the term "diffuse" for the lines. [18] They classified alkali metal spectral lines into sharp and diffuse categories. In 1890 the lines that also appeared in the absorption spectrum were termed the principal series. Rydberg continued the use of sharp and diffuse for the other lines, [19] whereas Kayser and Runge preferred to use the term first subordinate series for the diffuse series. [20]

Arno Bergmann found a fourth series in infrared in 1907, and this became known as Bergmann Series or fundamental series. [20]

Heinrich Kayser, Carl Runge and Johannes Rydberg found mathematical relations between the wave numbers of emission lines of the alkali metals. [21]

Friedrich Hund introduced the s, p, d, f notation for subshells in atoms. [21] [22] Others followed this use in the 1930s and the terminology has remained to this day.

Related Research Articles

<span class="mw-page-title-main">Atomic orbital</span> Mathematical function describing the location and behavior of an electron within an atom

In atomic theory and quantum mechanics, an atomic orbital is a function describing the location and wave-like behavior of an electron in an atom. This function can be used to calculate the probability of finding any electron of an atom in any specific region around the atom's nucleus. The term atomic orbital may also refer to the physical region or space where the electron can be calculated to be present, as predicted by the particular mathematical form of the orbital.

<span class="mw-page-title-main">Bohr model</span> Atomic model introduced by Niels Bohr in 1913

In atomic physics, the Bohr model or Rutherford–Bohr model of the atom, presented by Niels Bohr and Ernest Rutherford in 1913, consists of a small, dense nucleus surrounded by orbiting electrons. It is analogous to the structure of the Solar System, but with attraction provided by electrostatic force rather than gravity. In the history of atomic physics, it followed, and ultimately replaced, several earlier models, including Joseph Larmor's solar system model (1897), Jean Perrin's model (1901), the cubical model (1902), Hantaro Nagaoka's Saturnian model (1904), the plum pudding model (1904), Arthur Haas's quantum model (1910), the Rutherford model (1911), and John William Nicholson's nuclear quantum model (1912). The improvement over the 1911 Rutherford model mainly concerned the new quantum mechanical interpretation introduced by Haas and Nicholson, but forsaking any attempt to explain radiation according to classical physics.

In spectroscopy, the Rydberg constant, symbol for heavy atoms or for hydrogen, named after the Swedish physicist Johannes Rydberg, is a physical constant relating to the electromagnetic spectra of an atom. The constant first arose as an empirical fitting parameter in the Rydberg formula for the hydrogen spectral series, but Niels Bohr later showed that its value could be calculated from more fundamental constants according to his model of the atom.

<span class="mw-page-title-main">Rydberg formula</span> Formula for spectral line wavelengths in alkali metals

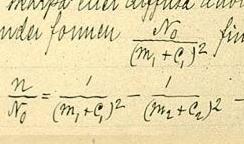
In atomic physics, the Rydberg formula calculates the wavelengths of a spectral line in many chemical elements. The formula was primarily presented as a generalization of the Balmer series for all atomic electron transitions of hydrogen. It was first empirically stated in 1888 by the Swedish physicist Johannes Rydberg, then theoretically by Niels Bohr in 1913, who used a primitive form of quantum mechanics. The formula directly generalizes the equations used to calculate the wavelengths of the hydrogen spectral series.

The Balmer series, or Balmer lines in atomic physics, is one of a set of six named series describing the spectral line emissions of the hydrogen atom. The Balmer series is calculated using the Balmer formula, an empirical equation discovered by Johann Balmer in 1885.

In physics and chemistry, the Lyman series is a hydrogen spectral series of transitions and resulting ultraviolet emission lines of the hydrogen atom as an electron goes from n ≥ 2 to n = 1, the lowest energy level of the electron. The transitions are named sequentially by Greek letters: from n = 2 to n = 1 is called Lyman-alpha, 3 to 1 is Lyman-beta, 4 to 1 is Lyman-gamma, and so on. The series is named after its discoverer, Theodore Lyman. The greater the difference in the principal quantum numbers, the higher the energy of the electromagnetic emission.

In atomic physics, a term symbol is an abbreviated description of the total spin and orbital angular momentum quantum numbers of the electrons in a multi-electron atom. So while the word symbol suggests otherwise, is represents an actual value of a physical quantity.

<span class="mw-page-title-main">Rydberg atom</span> Excited atomic quantum state with high principal quantum number (n)

A Rydberg atom is an excited atom with one or more electrons that have a very high principal quantum number, n. The higher the value of n, the farther the electron is from the nucleus, on average. Rydberg atoms have a number of peculiar properties including an exaggerated response to electric and magnetic fields, long decay periods and electron wavefunctions that approximate, under some conditions, classical orbits of electrons about the nuclei. The core electrons shield the outer electron from the electric field of the nucleus such that, from a distance, the electric potential looks identical to that experienced by the electron in a hydrogen atom.

<span class="mw-page-title-main">Aufbau principle</span> Principle of atomic physics

The aufbau principle, also called the aufbau rule, states that in the ground state of an atom or ion, electrons fill subshells of the lowest available energy, then they fill subshells of higher energy. For example, the 1s subshell is filled before the 2s subshell is occupied. In this way, the electrons of an atom or ion form the most stable electron configuration possible. An example is the configuration 1s2 2s2 2p6 3s2 3p3 for the phosphorus atom, meaning that the 1s subshell has 2 electrons, and so on.

<span class="mw-page-title-main">Trihydrogen cation</span> Polyatomic ion (H₃, charge +1)

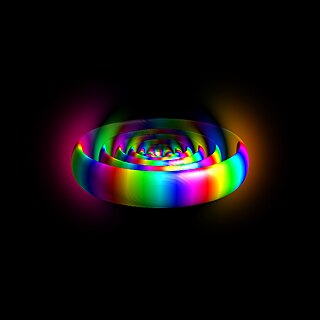
The trihydrogen cation or protonated molecular hydrogen is a cation with formula H+
3
, consisting of three hydrogen nuclei (protons) sharing two electrons.

<span class="mw-page-title-main">Hydrogen spectral series</span> Important atomic emission spectra

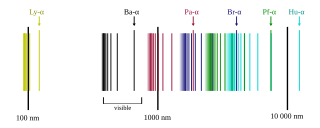
The emission spectrum of atomic hydrogen has been divided into a number of spectral series, with wavelengths given by the Rydberg formula. These observed spectral lines are due to the electron making transitions between two energy levels in an atom. The classification of the series by the Rydberg formula was important in the development of quantum mechanics. The spectral series are important in astronomical spectroscopy for detecting the presence of hydrogen and calculating red shifts.

The Rydberg–Ritz combination principle is an empirical rule proposed by Walther Ritz in 1908 to describe the relationship of the spectral lines for all atoms, as a generalization of an earlier rule by Johannes Rydberg for the hydrogen atom and the alkali metals. The principle states that the spectral lines of any element include frequencies that are either the sum or the difference of the frequencies of two other lines. Lines of the spectra of elements could be predicted from existing lines. Since the frequency of light is proportional to the wavenumber or reciprocal wavelength, the principle can also be expressed in terms of wavenumbers which are the sum or difference of wavenumbers of two other lines.

The Rydberg states of an atom or molecule are electronically excited states with energies that follow the Rydberg formula as they converge on an ionic state with an ionization energy. Although the Rydberg formula was developed to describe atomic energy levels, it has been used to describe many other systems that have electronic structure roughly similar to atomic hydrogen. In general, at sufficiently high principal quantum numbers, an excited electron-ionic core system will have the general character of a hydrogenic system and the energy levels will follow the Rydberg formula. Rydberg states have energies converging on the energy of the ion. The ionization energy threshold is the energy required to completely liberate an electron from the ionic core of an atom or molecule. In practice, a Rydberg wave packet is created by a laser pulse on a hydrogenic atom and thus populates a superposition of Rydberg states. Modern investigations using pump-probe experiments show molecular pathways – e.g. dissociation of (NO)2 – via these special states.

The Inglis–Teller equation represents an approximate relationship between the plasma density and the principal quantum number of the highest bound state of an atom. The equation was derived by David R. Inglis and Edward Teller in 1939.

<span class="mw-page-title-main">Imidogen</span> Inorganic radical with the chemical formula NH

Imidogen is an inorganic compound with the chemical formula NH. Like other simple radicals, it is highly reactive and consequently short-lived except as a dilute gas. Its behavior depends on its spin multiplicity.

The Pickering series (also known as the Pickering–Fowler series) consists of three lines of singly ionized helium found, usually in absorption, in the spectra of hot stars like Wolf–Rayet stars. The name comes from Edward Charles Pickering and Alfred Fowler. The lines are produced by transitions from a higher energy level of an electron to a level with principal quantum number n = 4. The lines have wavelengths:

<span class="mw-page-title-main">History of spectroscopy</span>

Modern spectroscopy in the Western world started in the 17th century. New designs in optics, specifically prisms, enabled systematic observations of the solar spectrum. Isaac Newton first applied the word spectrum to describe the rainbow of colors that combine to form white light. During the early 1800s, Joseph von Fraunhofer conducted experiments with dispersive spectrometers that enabled spectroscopy to become a more precise and quantitative scientific technique. Since then, spectroscopy has played and continues to play a significant role in chemistry, physics and astronomy. Fraunhofer observed and measured dark lines in the Sun's spectrum, which now bear his name although several of them were observed earlier by Wollaston.

The sharp series is a series of spectral lines in the atomic emission spectrum caused when electrons descend from higher-energy s orbitals of an atom to the lowest available p orbital. The spectral lines include some in the visible light, and they extend into the ultraviolet. The lines get closer and closer together as the frequency increases never exceeding the series limit. The sharp series was important in the development of the understanding of electron shells and subshells in atoms. The sharp series has given the letter s to the s atomic orbital or subshell.

The fundamental series is a set of spectral lines in a set caused by transition between d and f orbitals in atoms.

<span class="mw-page-title-main">Principal series (spectroscopy)</span> Series of lines in atomic spectra

In atomic emission spectroscopy, the principal series is a series of spectral lines caused when electrons move between p orbitals of an atom and the lowest available s orbital. These lines are usually found in the visible and ultraviolet portions of the electromagnetic spectrum. The principal series has given the letter p to the p atomic orbital and subshell.

References

  1. Fowler, A. (1924). "The Origin of Spectra". Journal of the Royal Astronomical Society of Canada. 18: 373–380. Bibcode:1924JRASC..18..373F.
  2. 1 2 Saunders, F. A. (1915). "Some Recent Discoveries in Spectrum Series". Astrophysical Journal. 41: 323. Bibcode:1915ApJ....41..323S. doi:10.1086/142175.
  3. 1 2 3 Saunders, F. A. (1915). "Some Recent Discoveries in Spectrum Series". Astrophysical Journal. 41: 323–327. Bibcode:1915ApJ....41..323S. doi:10.1086/142175.
  4. Rydberg, J. R. (1897). "The New Series in the Spectrum of Hydrogen". Astrophysical Journal. 6: 233–236. Bibcode:1897ApJ.....6..233R. doi:10.1086/140393.
  5. Band, Yehuda B. (14 September 2006). Light and Matter: Electromagnetism, Optics, Spectroscopy and Lasers. John Wiley. ISBN   9780471899310 . Retrieved 3 July 2015.
  6. Band, Yehuda B. (2006-09-14). Light and Matter: Electromagnetism, Optics, Spectroscopy and Lasers. John Wiley & Sons. pp. 321–322. ISBN   9780471899310 . Retrieved 10 January 2014.
  7. Schuster, Arthur (31 December 1986). "On a New Law Connecting the Periods of Molecular Vibrations". Nature. 55 (1418): 200–201. Bibcode:1896Natur..55..200S. doi: 10.1038/055200a0 .
  8. Schuster, Arthur (7 January 1987). "On a New Law Connecting the Periods of Molecular Vibrations". Nature. 55 (1419): 223. Bibcode:1897Natur..55..223S. doi:10.1038/055223a0. S2CID   4054702.
  9. 1 2 Atomic, Molecular and Laser Physics. Krishna Prakashan Media. p. 2.59.
  10. atomic spectra and the vector model. volume 1. series spectra. CUP Archive. p. 19. ISBN   9781001286228.
  11. 1 2 Sala, O.; Araki, K.; Noda, L. K. (September 1999). "A Procedure to Obtain the Effective Nuclear Charge from the Atomic Spectrum of Sodium" (PDF). Journal of Chemical Education. 76 (9): 1269. Bibcode:1999JChEd..76.1269S. doi:10.1021/ed076p1269.
  12. Wiese, W.; Smith, M. W.; Miles, B. M. (October 1969). Atomic Transition Probabilities Volume II Sodium Through Calcium A Critical Data Compilation. Washington: National Bureau of Standards. pp. 39–41.
  13. Wiese, W.; Smith, M. W.; Miles, B. M. (October 1969). Atomic Transition Probabilities Volume II Sodium Through Calcium A Critical Data Compilation (PDF). Washington: National Bureau of Standards. pp. 228–230. Archived from the original (PDF) on September 24, 2015.
  14. Saunders, F. A. (1919). "Review of Recent Work on the Series Spectra of Helium and of Hydrogen". Astrophysical Journal. 50: 151–154. Bibcode:1919ApJ....50..151S. doi:10.1086/142490.
  15. Saunders, F. A. (December 1920). "Revision of the Series in the Spectrum of Calcium". The Astrophysical Journal. 52 (5): 265. Bibcode:1920ApJ....52..265S. doi:10.1086/142578.
  16. Saunders, F. A. (1922). "Revision of the Series in the Spectrum of Strontium". Astrophysical Journal. 56: 73–82. Bibcode:1922ApJ....56...73S. doi:10.1086/142690.
  17. Saunders, F. A. (1920). "Revision of the Series in the Spectrum of Barium". Astrophysical Journal. 51: 23–36. Bibcode:1920ApJ....51...23S. doi:10.1086/142521.
  18. Brand, John Charles Drury (1995-10-01). Lines Of Light: The Sources Of Dispersive Spectroscopy, 1800-1930. CRC Press. pp. 123–. ISBN   9782884491624 . Retrieved 30 December 2013.
  19. Rydberg, J. R. (April 1890). "XXXIV. On the structure of the line-spectra of the chemical elements". Philosophical Magazine. Series 5. 29 (179): 331–337. doi:10.1080/14786449008619945.
  20. 1 2 Mehra, Jagdish; Rechenberg, Helmut (2001-01-01). The Historical Development of Quantum Theory. Springer. pp. 165–166. ISBN   9780387951744 . Retrieved 30 December 2013.
  21. 1 2 William B. Jensen (2007). "The Origin of the S, p, d, f Orbital Labels". Journal of Chemical Education. 84 (5): 757–758. Bibcode:2007JChEd..84..757J. doi:10.1021/ed084p757.
  22. Hund, Friedrich (1927). Linienspektren und Periodisches System der Elemente. Struktur der Materie in Einzeldarstellungen. Vol. 4. Springer. pp. 55–56. ISBN   9783709156568.