
Infrared spectroscopy involves the interaction of infrared radiation with matter. It covers a range of techniques, mostly based on absorption spectroscopy. As with all spectroscopic techniques, it can be used to identify and study chemical substances. Samples may be solid, liquid, or gas. The method or technique of infrared spectroscopy is conducted with an instrument called an infrared spectrometer to produce an infrared spectrum. An IR spectrum can be visualized in a graph of infrared light absorbance on the vertical axis vs. frequency or wavelength on the horizontal axis. Typical units of frequency used in IR spectra are reciprocal centimeters, with the symbol cm−1. Units of IR wavelength are commonly given in micrometers, symbol μm, which are related to wave numbers in a reciprocal way. A common laboratory instrument that uses this technique is a Fourier transform infrared (FTIR) spectrometer. Two-dimensional IR is also possible as discussed below.

Spectroscopy is the study of the interaction between matter and electromagnetic radiation. Historically, spectroscopy originated through the study of visible light dispersed according to its wavelength, by a prism. Later the concept was expanded greatly to include any interaction with radiative energy as a function of its wavelength or frequency, predominantly in the electromagnetic spectrum, although matter waves and acoustic waves can also be considered forms of radiative energy; recently, with tremendous difficulty, even gravitational waves have been associated with a spectral signature in the context of the Laser Interferometer Gravitational-Wave Observatory (LIGO) and laser interferometry. Spectroscopic data are often represented by an emission spectrum, a plot of the response of interest, as a function of wavelength or frequency.
An optical spectrometer is an instrument used to measure properties of light over a specific portion of the electromagnetic spectrum, typically used in spectroscopic analysis to identify materials. The variable measured is most often the light's intensity but could also, for instance, be the polarization state. The independent variable is usually the wavelength of the light or a unit directly proportional to the photon energy, such as reciprocal centimeters or electron volts, which has a reciprocal relationship to wavelength.

Raman spectroscopy ; is a spectroscopic technique typically used to determine vibrational modes of molecules, although rotational and other low-frequency modes of systems may also be observed. Raman spectroscopy is commonly used in chemistry to provide a structural fingerprint by which molecules can be identified.

Absorption spectroscopy refers to spectroscopic techniques that measure the absorption of radiation, as a function of frequency or wavelength, due to its interaction with a sample. The sample absorbs energy, i.e., photons, from the radiating field. The intensity of the absorption varies as a function of frequency, and this variation is the absorption spectrum. Absorption spectroscopy is performed across the electromagnetic spectrum.

Raman scattering or the Raman effect is the inelastic scattering of photons by matter, meaning that there is an exchange of energy and a change in the light's direction. Typically this involves vibrational energy being gained by a molecule as incident photons from a visible laser are shifted to lower energy. This is called normal Stokes Raman scattering. The effect is exploited by chemists and physicists to gain information about materials for a variety of purposes by performing various forms of Raman spectroscopy. Many other variants of Raman spectroscopy allow rotational energy to be examined and electronic energy levels may be examined if an X-ray source is used in addition to other possibilities. More complex techniques involving pulsed lasers, multiple laser beams and so on are known.
Thermal infrared spectroscopy is the subset of infrared spectroscopy that deals with radiation emitted in the infrared part of the electromagnetic spectrum. The emitted infrared radiation, though similar to blackbody radiation, is different in that the radiation is banded at characteristic vibrations in the material. The method measures the thermal infrared radiation emitted from a volume or surface. This method is commonly used to identify the composition of surface by analyzing its spectrum and comparing it to previously measured materials. It is particularly suited to airborne and spaceborne applications.
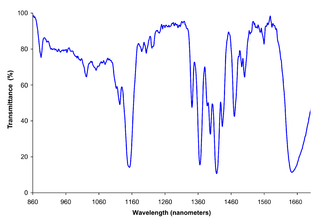
Near-infrared spectroscopy (NIRS) is a spectroscopic method that uses the near-infrared region of the electromagnetic spectrum. Typical applications include medical and physiological diagnostics and research including blood sugar, pulse oximetry, functional neuroimaging, sports medicine, elite sports training, ergonomics, rehabilitation, neonatal research, brain computer interface, urology, and neurology. There are also applications in other areas as well such as pharmaceutical, food and agrochemical quality control, atmospheric chemistry, combustion research and astronomy.
Resonance Raman spectroscopy is a Raman spectroscopy technique in which the incident photon energy is close in energy to an electronic transition of a compound or material under examination. The frequency coincidence can lead to greatly enhanced intensity of the Raman scattering, which facilitates the study of chemical compounds present at low concentrations.

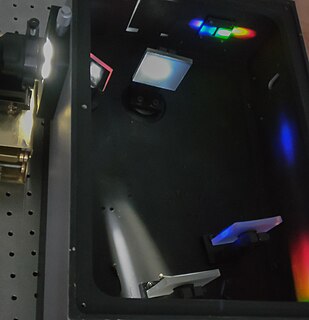
Matrix isolation is an experimental technique used in chemistry and physics. It generally involves a material being trapped within an unreactive matrix. A host matrix is a continuous solid phase in which guest particles are embedded. The guest is said to be isolated within the host matrix. Initially the term matrix-isolation was used to describe the placing of a chemical species in any unreactive material, often polymers or resins, but more recently has referred specifically to gases in low-temperature solids. A typical matrix isolation experiment involves a guest sample being diluted in the gas phase with the host material, usually a noble gas or nitrogen. This mixture is then deposited on a window that is cooled to below the melting point of the host gas. The sample may then be studied using various spectroscopic procedures.
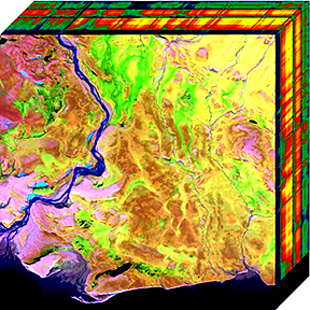
Hyperspectral imaging, like other spectral imaging, collects and processes information from across the electromagnetic spectrum. The goal of hyperspectral imaging is to obtain the spectrum for each pixel in the image of a scene, with the purpose of finding objects, identifying materials, or detecting processes. There are three general branches of spectral imagers. There are push broom scanners and the related whisk broom scanners, which read images over time, band sequential scanners, which acquire images of an area at different wavelengths, and snapshot hyperspectral imaging, which uses a staring array to generate an image in an instant.
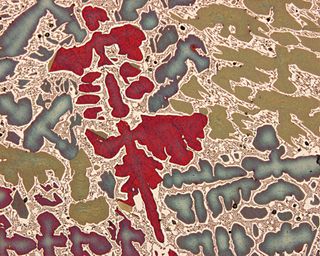
Characterization, when used in materials science, refers to the broad and general process by which a material's structure and properties are probed and measured. It is a fundamental process in the field of materials science, without which no scientific understanding of engineering materials could be ascertained. The scope of the term often differs; some definitions limit the term's use to techniques which study the microscopic structure and properties of materials, while others use the term to refer to any materials analysis process including macroscopic techniques such as mechanical testing, thermal analysis and density calculation. The scale of the structures observed in materials characterization ranges from angstroms, such as in the imaging of individual atoms and chemical bonds, up to centimeters, such as in the imaging of coarse grain structures in metals.
Chemical imaging is the analytical capability to create a visual image of components distribution from simultaneous measurement of spectra and spatial, time information. Hyperspectral imaging measures contiguous spectral bands, as opposed to multispectral imaging which measures spaced spectral bands.
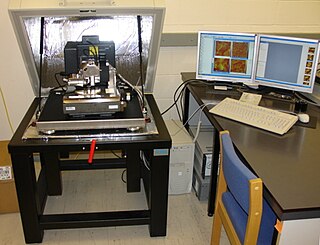
Photothermal microspectroscopy (PTMS), alternatively known as photothermal temperature fluctuation (PTTF), is derived from two parent instrumental techniques: infrared spectroscopy and atomic force microscopy (AFM). In one particular type of AFM, known as scanning thermal microscopy (SThM), the imaging probe is a sub-miniature temperature sensor, which may be a thermocouple or a resistance thermometer. This same type of detector is employed in a PTMS instrument, enabling it to provide AFM/SThM images: However, the chief additional use of PTMS is to yield infrared spectra from sample regions below a micrometer, as outlined below.
The technique of vibrational analysis with scanning probe microscopy allows probing vibrational properties of materials at the submicrometer scale, and even of individual molecules. This is accomplished by integrating scanning probe microscopy (SPM) and vibrational spectroscopy. This combination allows for much higher spatial resolution than can be achieved with conventional Raman/FTIR instrumentation. The technique is also nondestructive, requires non-extensive sample preparation, and provides more contrast such as intensity contrast, polarization contrast and wavelength contrast, as well as providing specific chemical information and topography images simultaneously.
Applied Spectroscopy is a peer-reviewed scientific journal published monthly by the Society for Applied Spectroscopy, and it is also the official journal for this society. The editor-in-chief is Sergei G. Kazarian. The journal covers applications of spectroscopy in analytical chemistry, materials science, biotechnology, and chemical characterization.
Brian J. Orr is an Australian scientist known for his contributions to laser spectroscopy and optical parametric oscillators. He graduated with a BSc from the University of Sydney. Orr received his PhD from the University of Bristol and was a professor at the University of New South Wales prior to his professorship appointment at the Faculty of Science of Macquarie University.
AFM-IR is one of a family of techniques that are derived from a combination of two parent instrumental techniques; infrared spectroscopy and scanning probe microscopy (SPM). The term was first used to denote a method that combined a tuneable free electron laser with an atomic force microscope equipped with a sharp probe that measured the local absorption of infrared light by a sample; it required that the sample be coupled to an infrared-transparent prism and be less than 1μm thick. It improved the spatial resolution of photothermal AFM-based techniques from microns to circa 100 nm.
Michael David Fayer is an American chemical physicist. He is the David Mulvane Ehrsam and Edward Curtis Franklin Professor of Chemistry at Stanford University.

Nano-FTIR is a scanning probe technique that can be considered as a combination of two techniques: Fourier transform infrared spectroscopy (FTIR) and scattering-type scanning near-field optical microscopy (s-SNOM). As s-SNOM, nano-FTIR is based on atomic-force microscopy (AFM), where a sharp tip is illuminated by an external light source and the tip-scattered light is detected as a function of tip position. A typical nano-FTIR setup thus consists of an atomic force microscope, a broadband infrared light source used for tip illumination, and a Michelson interferometer acting as Fourier transform spectrometer. In nano-FTIR, the sample stage is placed in one of the interferometer arms, which allows for recording both amplitude and phase of the detected light. Scanning the tip allows for performing hyperspectral imaging with nanoscale spatial resolution determined by the tip apex size. The use of broadband infrared sources enables the acquisition of continuous spectra, which is a distinctive feature of nano-FTIR compared to s-SNOM. Nano-FTIR is capable of performing infrared (IR) spectroscopy of materials in ultrasmall quantities and with nanoscale spatial resolution. The detection of a single molecular complex and the sensitivity to a single monolayer has been shown. Recording infrared spectra as a function of position can be used for nanoscale mapping of the sample chemical composition, performing a local ultrafast IR spectroscopy and analyzing the nanoscale intermolecular coupling, among others. A spatial resolution of 10 nm to 20 nm is routinely achieved