Spectrum (physical sciences)

Last updated
Diagram illustrating the electromagnetic spectrum EM Spectrum Properties edit.svg
Diagram illustrating the electromagnetic spectrum

In the physical sciences, the term spectrum was introduced first into optics by Isaac Newton in the 17th century, referring to the range of colors observed when white light was dispersed through a prism. [1] [2] Soon the term referred to a plot of light intensity or power as a function of frequency or wavelength, also known as a spectral density plot.

Contents

Later it expanded to apply to other waves, such as sound waves and sea waves that could also be measured as a function of frequency (e.g., noise spectrum, sea wave spectrum). It has also been expanded to more abstract "signals", whose power spectrum can be analyzed and processed. The term now applies to any signal that can be measured or decomposed along a continuous variable, such as energy in electron spectroscopy or mass-to-charge ratio in mass spectrometry. Spectrum is also used to refer to a graphical representation of the signal as a function of the dependent variable.

Etymology

In Latin, spectrum means "image" or "apparition", including the meaning "spectre". Spectral evidence is testimony about what was done by spectres of persons not present physically, or hearsay evidence about what ghosts or apparitions of Satan said. It was used to convict a number of persons of witchcraft at Salem, Massachusetts in the late 17th century. The word "spectrum" [Spektrum] was strictly used to designate a ghostly optical afterimage by Goethe in his Theory of Colors and Schopenhauer in On Vision and Colors .

The prefix "spectro-" is used to form words relating to spectra. For example, a spectrometer is a device used to record spectra and spectroscopy is the use of a spectrometer for chemical analysis.

Electromagnetic spectrum

Electromagnetic emission spectrum of a fluorescent lamp Fluorescent lighting spectrum peaks labelled.svg
Electromagnetic emission spectrum of a fluorescent lamp

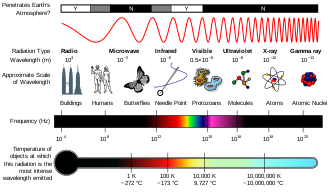
Electromagnetic spectrum refers to the full range of all frequencies of electromagnetic radiation [3] and also to the characteristic distribution of electromagnetic radiation emitted or absorbed by that particular object. Devices used to measure an electromagnetic spectrum are called spectrograph or spectrometer. The visible spectrum is the part of the electromagnetic spectrum that can be seen by the human eye. The wavelength of visible light ranges from 390 to 700 nm. [4] The absorption spectrum of a chemical element or chemical compound is the spectrum of frequencies or wavelengths of incident radiation that are absorbed by the compound due to electron transitions from a lower to a higher energy state. The emission spectrum refers to the spectrum of radiation emitted by the compound due to electron transitions from a higher to a lower energy state.

Light from many different sources contains various colors, each with its own brightness or intensity. A rainbow, or prism, sends these component colors in different directions, making them individually visible at different angles. A graph of the intensity plotted against the frequency (showing the brightness of each color) is the frequency spectrum of the light. When all the visible frequencies are present equally, the perceived color of the light is white, and the spectrum is a flat line. Therefore, flat-line spectra in general are often referred to as white, whether they represent light or another type of wave phenomenon (sound, for example, or vibration in a structure).

In radio and telecommunications, the frequency spectrum can be shared among many different broadcasters. The radio spectrum is the part of the electromagnetic spectrum corresponding to frequencies lower below 300 GHz, which corresponds to wavelengths longer than about 1 mm. The microwave spectrum corresponds to frequencies between 300 MHz (0.3  GHz) and 300 GHz and wavelengths between one meter and one millimeter. [5] [6] Each broadcast radio and TV station transmits a wave on an assigned frequency range, called a channel. When many broadcasters are present, the radio spectrum consists of the sum of all the individual channels, each carrying separate information, spread across a wide frequency spectrum. Any particular radio receiver will detect a single function of amplitude (voltage) vs. time. The radio then uses a tuned circuit or tuner to select a single channel or frequency band and demodulate or decode the information from that broadcaster. If we made a graph of the strength of each channel vs. the frequency of the tuner, it would be the frequency spectrum of the antenna signal.

In astronomical spectroscopy, the strength, shape, and position of absorption and emission lines, as well as the overall spectral energy distribution of the continuum, reveal many properties of astronomical objects. Stellar classification is the categorisation of stars based on their characteristic electromagnetic spectra. The spectral flux density is used to represent the spectrum of a light-source, such as a star.

In radiometry and colorimetry (or color science more generally), the spectral power distribution (SPD) of a light source is a measure of the power contributed by each frequency or color in a light source. The light spectrum is usually measured at points (often 31) along the visible spectrum, in wavelength space instead of frequency space, which makes it not strictly a spectral density. Some spectrophotometers can measure increments as fine as one to two nanometers and even higher resolution devices with resolutions less than 0.5 nm have been reported. [7] the values are used to calculate other specifications and then plotted to show the spectral attributes of the source. This can be helpful in analyzing the color characteristics of a particular source.

Mass spectrum

Mass spectrum of Titan's ionosphere Titan atmosphere diagram.png
Mass spectrum of Titan's ionosphere

A plot of ion abundance as a function of mass-to-charge ratio is called a mass spectrum. It can be produced by a mass spectrometer instrument. [8] The mass spectrum can be used to determine the quantity and mass of atoms and molecules. Tandem mass spectrometry is used to determine molecular structure.

Energy spectrum

In physics, the energy spectrum of a particle is the number of particles or intensity of a particle beam as a function of particle energy. Examples of techniques that produce an energy spectrum are alpha-particle spectroscopy, electron energy loss spectroscopy, and mass-analyzed ion-kinetic-energy spectrometry.

Displacement

Oscillatory displacements, including vibrations, can also be characterized spectrally.

Acoustical measurement

In acoustics, a spectrogram is a visual representation of the frequency spectrum of sound as a function of time or another variable.

A source of sound can have many different frequencies mixed. A musical tone's timbre is characterized by its harmonic spectrum. Sound in our environment that we refer to as noise includes many different frequencies. When a sound signal contains a mixture of all audible frequencies, distributed equally over the audio spectrum, it is called white noise. [12]

The spectrum analyzer is an instrument which can be used to convert the sound wave of the musical note into a visual display of the constituent frequencies. This visual display is referred to as an acoustic spectrogram. Software based audio spectrum analyzers are available at low cost, providing easy access not only to industry professionals, but also to academics, students and the hobbyist. The acoustic spectrogram generated by the spectrum analyzer provides an acoustic signature of the musical note. In addition to revealing the fundamental frequency and its overtones, the spectrogram is also useful for analysis of the temporal attack, decay, sustain, and release of the musical note.

Continuous versus discrete spectra

Continuous spectrum of an incandescent lamp (mid) and discrete spectrum lines of a fluorescent lamp (bottom) Simple spectroscope.jpg
Continuous spectrum of an incandescent lamp (mid) and discrete spectrum lines of a fluorescent lamp (bottom)

In the physical sciences, the spectrum of a physical quantity (such as energy) may be called continuous if it is non-zero over the whole spectrum domain (such as frequency or wavelength) or discrete if it attains non-zero values only in a discrete set over the independent variable, with band gaps between pairs of spectral bands or spectral lines . [13]

The classical example of a continuous spectrum, from which the name is derived, is the part of the spectrum of the light emitted by excited atoms of hydrogen that is due to free electrons becoming bound to a hydrogen ion and emitting photons, which are smoothly spread over a wide range of wavelengths, in contrast to the discrete lines due to electrons falling from some bound quantum state to a state of lower energy. As in that classical example, the term is most often used when the range of values of a physical quantity may have both a continuous and a discrete part, whether at the same time or in different situations. In quantum systems, continuous spectra (as in bremsstrahlung and thermal radiation) are usually associated with free particles, such as atoms in a gas, electrons in an electron beam, or conduction band electrons in a metal. In particular, the position and momentum of a free particle has a continuous spectrum, but when the particle is confined to a limited space its spectrum becomes discrete.

Often a continuous spectrum may be just a convenient model for a discrete spectrum whose values are too close to be distinguished, as in the phonons in a crystal.

The continuous and discrete spectra of physical systems can be modeled in functional analysis as different parts in the decomposition of the spectrum of a linear operator acting on a function space, such as the Hamiltonian operator.

The classical example of a discrete spectrum (for which the term was first used) is the characteristic set of discrete spectral lines seen in the emission spectrum and absorption spectrum of isolated atoms of a chemical element, which only absorb and emit light at particular wavelengths. The technique of spectroscopy is based on this phenomenon.

Discrete spectra are seen in many other phenomena, such as vibrating strings, microwaves in a metal cavity, sound waves in a pulsating star, and resonances in high-energy particle physics. The general phenomenon of discrete spectra in physical systems can be mathematically modeled with tools of functional analysis, specifically by the decomposition of the spectrum of a linear operator acting on a functional space.

In classical mechanics

In classical mechanics, discrete spectra are often associated to waves and oscillations in a bounded object or domain. Mathematically they can be identified with the eigenvalues of differential operators that describe the evolution of some continuous variable (such as strain or pressure) as a function of time and/or space.

Discrete spectra are also produced by some non-linear oscillators where the relevant quantity has a non-sinusoidal waveform. Notable examples are the sound produced by the vocal cords of mammals. [14] [15] :p.684 and the stridulation organs of crickets, [16] whose spectrum shows a series of strong lines at frequencies that are integer multiples (harmonics) of the oscillation frequency.

A related phenomenon is the appearance of strong harmonics when a sinusoidal signal (which has the ultimate "discrete spectrum", consisting of a single spectral line) is modified by a non-linear filter; for example, when a pure tone is played through an overloaded amplifier, [17] or when an intense monochromatic laser beam goes through a non-linear medium. [18] In the latter case, if two arbitrary sinusoidal signals with frequencies f and g are processed together, the output signal will generally have spectral lines at frequencies |mf + ng|, where m and n are any integers.

In quantum mechanics

In quantum mechanics, the discrete spectrum of an observable refers to the pure point spectrum of eigenvalues of the operator used to model that observable. [19] [20]

Discrete spectra are usually associated with systems that are bound in some sense (mathematically, confined to a compact space).[ citation needed ] The position and momentum operators have continuous spectra in an infinite domain, but a discrete (quantized) spectrum in a compact domain and the same properties of spectra hold for angular momentum, Hamiltonians and other operators of quantum systems.

The quantum harmonic oscillator and the hydrogen atom are examples of physical systems in which the Hamiltonian has a discrete spectrum. In the case of the hydrogen atom the spectrum has both a continuous and a discrete part, the continuous part representing the ionization.

See also

Related Research Articles

<span class="mw-page-title-main">Electromagnetic radiation</span> Waves of the electromagnetic field

In physics, electromagnetic radiation (EMR) consists of waves of the electromagnetic (EM) field, which propagate through space and carry momentum and electromagnetic radiant energy. Types of EMR include radio waves, microwaves, infrared, (visible) light, ultraviolet, X-rays, and gamma rays, all of which are part of the electromagnetic spectrum.

<span class="mw-page-title-main">Electromagnetic spectrum</span> Range of frequencies or wavelengths of electromagnetic radiation

The electromagnetic spectrum is the full range of electromagnetic radiation, organized by frequency or wavelength. The spectrum is divided into separate bands, with different names for the electromagnetic waves within each band. From low to high frequency these are: radio waves, microwaves, infrared, visible light, ultraviolet, X-rays, and gamma rays. The electromagnetic waves in each of these bands have different characteristics, such as how they are produced, how they interact with matter, and their practical applications.

<span class="mw-page-title-main">Radiation</span> Waves or particles moving through space

In physics, radiation is the emission or transmission of energy in the form of waves or particles through space or a material medium. This includes:

<span class="mw-page-title-main">Spectroscopy</span> Study involving matter and electromagnetic radiation

Spectroscopy is the field of study that measures and interprets electromagnetic spectra. In narrower contexts, spectroscopy is the precise study of color as generalized from visible light to all bands of the electromagnetic spectrum.

<span class="mw-page-title-main">Spectrum</span> Continuous range of values, such as wavelengths in physics

A spectrum is a condition that is not limited to a specific set of values but can vary, without gaps, across a continuum. The word spectrum was first used scientifically in optics to describe the rainbow of colors in visible light after passing through a prism. As scientific understanding of light advanced, it came to apply to the entire electromagnetic spectrum. It thereby became a mapping of a range of magnitudes (wavelengths) to a range of qualities, which are the perceived "colors of the rainbow" and other properties which correspond to wavelengths that lie outside of the visible light spectrum.

Fourier-transform spectroscopy is a measurement technique whereby spectra are collected based on measurements of the coherence of a radiative source, using time-domain or space-domain measurements of the radiation, electromagnetic or not. It can be applied to a variety of types of spectroscopy including optical spectroscopy, infrared spectroscopy, nuclear magnetic resonance (NMR) and magnetic resonance spectroscopic imaging (MRSI), mass spectrometry and electron spin resonance spectroscopy.

Atomic, molecular, and optical physics (AMO) is the study of matter–matter and light–matter interactions, at the scale of one or a few atoms and energy scales around several electron volts. The three areas are closely interrelated. AMO theory includes classical, semi-classical and quantum treatments. Typically, the theory and applications of emission, absorption, scattering of electromagnetic radiation (light) from excited atoms and molecules, analysis of spectroscopy, generation of lasers and masers, and the optical properties of matter in general, fall into these categories.

<span class="mw-page-title-main">Energy level</span> Different states of quantum systems

A quantum mechanical system or particle that is bound—that is, confined spatially—can only take on certain discrete values of energy, called energy levels. This contrasts with classical particles, which can have any amount of energy. The term is commonly used for the energy levels of the electrons in atoms, ions, or molecules, which are bound by the electric field of the nucleus, but can also refer to energy levels of nuclei or vibrational or rotational energy levels in molecules. The energy spectrum of a system with such discrete energy levels is said to be quantized.

<span class="mw-page-title-main">Scattering</span> Range of physical processes

Scattering is a term used in physics to describe a wide range of physical processes where moving particles or radiation of some form, such as light or sound, are forced to deviate from a straight trajectory by localized non-uniformities in the medium through which they pass. In conventional use, this also includes deviation of reflected radiation from the angle predicted by the law of reflection. Reflections of radiation that undergo scattering are often called diffuse reflections and unscattered reflections are called specular (mirror-like) reflections. Originally, the term was confined to light scattering. As more "ray"-like phenomena were discovered, the idea of scattering was extended to them, so that William Herschel could refer to the scattering of "heat rays" in 1800. John Tyndall, a pioneer in light scattering research, noted the connection between light scattering and acoustic scattering in the 1870s. Near the end of the 19th century, the scattering of cathode rays and X-rays was observed and discussed. With the discovery of subatomic particles and the development of quantum theory in the 20th century, the sense of the term became broader as it was recognized that the same mathematical frameworks used in light scattering could be applied to many other phenomena.

<span class="mw-page-title-main">Spectral line</span> A distinctive narrow spectral feature of chemical species

A spectral line is a weaker or stronger region in an otherwise uniform and continuous spectrum. It may result from emission or absorption of light in a narrow frequency range, compared with the nearby frequencies. Spectral lines are often used to identify atoms and molecules. These "fingerprints" can be compared to the previously collected ones of atoms and molecules, and are thus used to identify the atomic and molecular components of stars and planets, which would otherwise be impossible.

<span class="mw-page-title-main">Emission spectrum</span> Frequencies of light emitted by atoms or chemical compounds

The emission spectrum of a chemical element or chemical compound is the spectrum of frequencies of electromagnetic radiation emitted due to electrons making a transition from a high energy state to a lower energy state. The photon energy of the emitted photons is equal to the energy difference between the two states. There are many possible electron transitions for each atom, and each transition has a specific energy difference. This collection of different transitions, leading to different radiated wavelengths, make up an emission spectrum. Each element's emission spectrum is unique. Therefore, spectroscopy can be used to identify elements in matter of unknown composition. Similarly, the emission spectra of molecules can be used in chemical analysis of substances.

<span class="mw-page-title-main">Absorption spectroscopy</span> Spectroscopic techniques that measure the absorption of radiation

Absorption spectroscopy is spectroscopy that involves techniques that measure the absorption of electromagnetic radiation, as a function of frequency or wavelength, due to its interaction with a sample. The sample absorbs energy, i.e., photons, from the radiating field. The intensity of the absorption varies as a function of frequency, and this variation is the absorption spectrum. Absorption spectroscopy is performed across the electromagnetic spectrum.

In physics, atomic spectroscopy is the study of the electromagnetic radiation absorbed and emitted by atoms. Since unique elements have unique emission spectra, atomic spectroscopy is applied for determination of elemental compositions. It can be divided by atomization source or by the type of spectroscopy used. In the latter case, the main division is between optical and mass spectrometry. Mass spectrometry generally gives significantly better analytical performance, but is also significantly more complex. This complexity translates into higher purchase costs, higher operational costs, more operator training, and a greater number of components that can potentially fail. Because optical spectroscopy is often less expensive and has performance adequate for many tasks, it is far more common. Atomic absorption spectrometers are one of the most commonly sold and used analytical devices.

<span class="mw-page-title-main">Absorption band</span> Range on the electromagnetic spectrum

In quantum mechanics, an absorption band is a range of wavelengths, frequencies or energies in the electromagnetic spectrum that are characteristic of a particular transition from initial to final state in a substance.

<span class="mw-page-title-main">Hydrogen spectral series</span> Important atomic emission spectra

The emission spectrum of atomic hydrogen has been divided into a number of spectral series, with wavelengths given by the Rydberg formula. These observed spectral lines are due to the electron making transitions between two energy levels in an atom. The classification of the series by the Rydberg formula was important in the development of quantum mechanics. The spectral series are important in astronomical spectroscopy for detecting the presence of hydrogen and calculating red shifts.

<span class="mw-page-title-main">Spectral band</span>

Spectral bands are regions of a given spectrum, having a specific range of wavelengths or frequencies. Most often, it refers to electromagnetic bands, regions of the electromagnetic spectrum.

The history of quantum mechanics is a fundamental part of the history of modern physics. The major chapters of this history begin with the emergence of quantum ideas to explain individual phenomena—blackbody radiation, the photoelectric effect, solar emission spectra—an era called the Old or Older quantum theories. Building on the technology developed in classical mechanics, the invention of wave mechanics by Erwin Schrödinger and expansion by many others triggers the "modern" era beginning around 1925. Paul Dirac's relativistic quantum theory work lead him to explore quantum theories of radiation, culminating in quantum electrodynamics, the first quantum field theory. The history of quantum mechanics continues in the history of quantum field theory. The history of quantum chemistry, theoretical basis of chemical structure, reactivity, and bonding, interlaces with the events discussed in this article.

Photoelectrochemical processes are processes in photoelectrochemistry; they usually involve transforming light into other forms of energy. These processes apply to photochemistry, optically pumped lasers, sensitized solar cells, luminescence, and photochromism.

This glossary of physics is a list of definitions of terms and concepts relevant to physics, its sub-disciplines, and related fields, including mechanics, materials science, nuclear physics, particle physics, and thermodynamics. For more inclusive glossaries concerning related fields of science and technology, see Glossary of chemistry terms, Glossary of astronomy, Glossary of areas of mathematics, and Glossary of engineering.

<span class="mw-page-title-main">Spectrometer</span> Used to measure spectral components of light

A spectrometer is a scientific instrument used to separate and measure spectral components of a physical phenomenon. Spectrometer is a broad term often used to describe instruments that measure a continuous variable of a phenomenon where the spectral components are somehow mixed. In visible light a spectrometer can separate white light and measure individual narrow bands of color, called a spectrum. A mass spectrometer measures the spectrum of the masses of the atoms or molecules present in a gas. The first spectrometers were used to split light into an array of separate colors. Spectrometers were developed in early studies of physics, astronomy, and chemistry. The capability of spectroscopy to determine chemical composition drove its advancement and continues to be one of its primary uses. Spectrometers are used in astronomy to analyze the chemical composition of stars and planets, and spectrometers gather data on the origin of the universe.

References

  1. Open Access logo PLoS transparent.svg OpenStax Astronomy, "Spectroscopy in Astronomy". OpenStax CNX. September 29, 2016 "OpenStax CNX". Archived from the original on February 17, 2017. Retrieved February 17, 2017.
  2. Newton, Isaac (1671). "A letter of Mr. Isaac Newton … containing his new theory about light and colours …". Philosophical Transactions of the Royal Society of London. 6 (80): 3075–3087. Bibcode:1671RSPT....6.3075N. doi: 10.1098/rstl.1671.0072 . The word "spectrum" to describe a band of colors that has been produced, by refraction or diffraction, from a beam of light first appears on p. 3076.
  3. "Electromagnetic spectrum". Imagine the Universe! Dictionary. NASA. Archived from the original on May 24, 2015. Retrieved June 3, 2015.
  4. Starr, Cecie (2005). Biology: Concepts and Applications . Thomson Brooks/Cole. p.  94. ISBN   0-534-46226-X.
  5. Pozar, David M. (1993). Microwave Engineering Addison–Wesley Publishing Company. ISBN   0-201-50418-9.
  6. Sorrentino, R. and Bianchi, Giovanni (2010) Microwave and RF Engineering Archived August 5, 2016, at the Wayback Machine , John Wiley & Sons, p. 4, ISBN   047066021X.
  7. Noui, Louahab; Hill, Jonathan; Keay, Peter J; Wang, Robert Y; Smith, Trevor; Yeung, Ken; Habib, George; Hoare, Mike (2002-02-01). "Development of a high resolution UV spectrophotometer for at-line monitoring of bioprocesses". Chemical Engineering and Processing: Process Intensification. 41 (2): 107–114. doi:10.1016/S0255-2701(01)00122-2. ISSN   0255-2701.
  8. IUPAC , Compendium of Chemical Terminology , 2nd ed. (the "Gold Book") (1997). Online corrected version: (2006) " mass spectrum ". doi : 10.1351/goldbook.M03749
  9. Munk, Walter H. (2010). "Origin and Generation of Waves". Coastal Engineering Proceedings. 1: 1. doi:10.9753/icce.v1.1.
  10. "Datums - NOAA Tides & Currents". tidesandcurrents.noaa.gov. December 2013. Archived from the original on 2022-12-06. Retrieved 2023-03-22.
  11. "A More Accurate Fourier Transform". SourceForge. Retrieved 2023-03-22.
  12. "white noise definition". yourdictionary.com. Archived from the original on June 30, 2015.
  13. "Continuous Spectrum - klinics.lib.kmutt.ac.th". KMUTT: Thailands Science General . 2 (1): 22. Archived from the original (PDF) on 2022-08-20 via KMUTT. In physics, a continuous spectrum usually means a set of achievable values for some physical quantity (such as energy or wavelength), best described as an interval of real numbers. It is the opposite of a discrete spectrum, a set of achievable values that are discrete in the mathematical sense where there is a positive gap between each value.[ dead link ]
  14. Hannu Pulakka (2005), Analysis of human voice production using inverse filtering, high-speed imaging, and electroglottography. Master's thesis, Helsinki University of Technology.
  15. Lindblom, Björn; Sundberg, Johan (2007). "The Human Voice in Speech and Singing". Springer Handbook of Acoustics. New York, NY: Springer New York. pp. 669–712. doi:10.1007/978-0-387-30425-0_16. ISBN   978-0-387-30446-5.
  16. Popov, A. V.; Shuvalov, V. F.; Markovich, A. M. (1976). "The spectrum of the calling signals, phonotaxis, and the auditory system in the cricket Gryllus bimaculatus". Neuroscience and Behavioral Physiology. 7 (1). Springer Science and Business Media LLC: 56–62. doi:10.1007/bf01148749. ISSN   0097-0549. PMID   1028002. S2CID   25407842.
  17. Paul V. Klipsch (1969), Modulation distortion in loudspeakers Archived 2016-03-04 at the Wayback Machine Journal of the Audio Engineering Society.
  18. Armstrong, J. A.; Bloembergen, N.; Ducuing, J.; Pershan, P. S. (1962-09-15). "Interactions between Light Waves in a Nonlinear Dielectric". Physical Review. 127 (6). American Physical Society (APS): 1918–1939. Bibcode:1962PhRv..127.1918A. doi: 10.1103/physrev.127.1918 . ISSN   0031-899X.
  19. Simon, B. (1978). "An Overview of Rigorous Scattering Theory". p. 3. S2CID   16913591.{{cite web}}: Missing or empty |url= (help)
  20. Teschl, G. (2009). "5.2 The RAGE theorem". Mathematical Methods in Quantum Mechanics (PDF). Providence, R.I: American Mathematical Soc. ISBN   978-0-8218-4660-5.