Related Research Articles
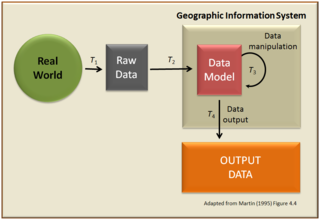
A geographic information system (GIS) is a type of database containing geographic data, combined with software tools for managing, analyzing, and visualizing those data. In a broader sense, one may consider such a system to also include human users and support staff, procedures and workflows, body of knowledge of relevant concepts and methods, and institutional organizations.

In modern mapping, a topographic map or topographic sheet is a type of map characterized by large-scale detail and quantitative representation of relief features, usually using contour lines, but historically using a variety of methods. Traditional definitions require a topographic map to show both natural and artificial features. A topographic survey is typically based upon a systematic observation and published as a map series, made up of two or more map sheets that combine to form the whole map. A topographic map series uses a common specification that includes the range of cartographic symbols employed, as well as a standard geodetic framework that defines the map projection, coordinate system, ellipsoid and geodetic datum. Official topographic maps also adopt a national grid referencing system.

A digital elevation model (DEM) or digital surface model (DSM) is a 3D computer graphics representation of elevation data to represent terrain or overlaying objects, commonly of a planet, moon, or asteroid. A "global DEM" refers to a discrete global grid. DEMs are used often in geographic information systems (GIS), and are the most common basis for digitally produced relief maps. A digital terrain model (DTM) represents specifically the ground surface while DEM and DSM may represent tree top canopy or building roofs.
Topography is the study of the forms and features of land surfaces. The topography of an area may refer to the land forms and features themselves, or a description or depiction in maps.
A GIS file format is a standard for encoding geographical information into a computer file, as a specialized type of file format for use in geographic information systems (GIS) and other geospatial applications. Since the 1970s, dozens of formats have been created based on various data models for various purposes. They have been created by government mapping agencies, GIS software vendors, standards bodies such as the Open Geospatial Consortium, informal user communities, and even individual developers.
Bathymetry is the study of underwater depth of ocean floors, lake floors, or river floors. In other words, bathymetry is the underwater equivalent to hypsometry or topography. The first recorded evidence of water depth measurements are from Ancient Egypt over 3000 years ago. Bathymetric charts are typically produced to support safety of surface or sub-surface navigation, and usually show seafloor relief or terrain as contour lines and selected depths (soundings), and typically also provide surface navigational information. Bathymetric maps may also use a Digital Terrain Model and artificial illumination techniques to illustrate the depths being portrayed. The global bathymetry is sometimes combined with topography data to yield a global relief model. Paleobathymetry is the study of past underwater depths.

NASA WorldWind is an open-source virtual globe. According to the website, "WorldWind is an open source virtual globe API. WorldWind allows developers to quickly and easily create interactive visualizations of 3D globe, map and geographical information. Organizations around the world use WorldWind to monitor weather patterns, visualize cities and terrain, track vehicle movement, analyze geospatial data and educate humanity about the Earth." It was first developed by NASA in 2003 for use on personal computers and then further developed in concert with the open source community since 2004. As of 2017, a web-based version of WorldWind is available online. An Android version is also available.

The National Map is a collaborative effort of the United States Geological Survey (USGS) and other federal, state, and local agencies to improve and deliver topographic information for the United States. The purpose of the effort is to provide "...a seamless, continuously maintained set of public domain geographic base information that will serve as a foundation for integrating, sharing, and using other data easily and consistently".

The elevation of a geographic location is its height above or below a fixed reference point, most commonly a reference geoid, a mathematical model of the Earth's sea level as an equipotential gravitational surface . The term elevation is mainly used when referring to points on the Earth's surface, while altitude or geopotential height is used for points above the surface, such as an aircraft in flight or a spacecraft in orbit, and depth is used for points below the surface.

The Shuttle Radar Topography Mission (SRTM) is an international research effort that obtained digital elevation models on a near-global scale from 56°S to 60°N, to generate the most complete high-resolution digital topographic database of Earth prior to the release of the ASTER GDEM in 2009. SRTM consisted of a specially modified radar system that flew on board the Space Shuttle Endeavour during the 11-day STS-99 mission in February 2000. The radar system was based on the older Spaceborne Imaging Radar-C/X-band Synthetic Aperture Radar (SIR-C/X-SAR), previously used on the Shuttle in 1994. To acquire topographic data, the SRTM payload was outfitted with two radar antennas. One antenna was located in the Shuttle's payload bay, the other – a critical change from the SIR-C/X-SAR, allowing single-pass interferometry – on the end of a 60-meter (200-foot) mast that extended from the payload bay once the Shuttle was in space. The technique employed is known as interferometric synthetic aperture radar. Intermap Technologies was the prime contractor for processing the interferometric synthetic aperture radar data.
The Vector Map (VMAP), also called Vector Smart Map, is a vector-based collection of geographic information system (GIS) data about Earth at various levels of detail. Level 0 coverage is global and entirely in the public domain. Level 1 is only partly in the public domain.
Geomorphometry, or geomorphometrics, is the science and practice of measuring the characteristics of terrain, the shape of the surface of the Earth, and the effects of this surface form on human and natural geography. It gathers various mathematical, statistical and image processing techniques that can be used to quantify morphological, hydrological, ecological and other aspects of a land surface. Common synonyms for geomorphometry are geomorphological analysis, terrain morphometry, terrain analysis, and land surface analysis. Geomorphometrics is the discipline based on the computational measures of the geometry, topography and shape of the Earth's horizons, and their temporal change. This is a major component of geographic information systems (GIS) and other software tools for spatial analysis.

The National Atlas of the United States was an atlas published by the United States Department of the Interior from 1874 to 1997.

The East Branch Brandywine Creek is a 27.4-mile-long (44.1 km) tributary of Brandywine Creek in Chester County, Pennsylvania in the United States.
Geographic information systems (GISs) have become a useful and important tool in the field of hydrology to study and manage Earth's water resources. Climate change and greater demands on water resources require a more knowledgeable disposition of arguably one of our most vital resources. Because water in its occurrence varies spatially and temporally throughout the hydrologic cycle, its study using GIS is especially practical. Whereas previous GIS systems were mostly static in their geospatial representation of hydrologic features, GIS platforms are becoming increasingly dynamic, narrowing the gap between historical data and current hydrologic reality.
A hydrological code or hydrologic unit code is a sequence of numbers or letters that identify a hydrological unit or feature, such as a river, river reach, lake, or area like a drainage basin or catchment.
The Fall River is a 3.3-mile-long (5.3 km) stream in northeastern Minnesota, the United States. It drops 860 feet (260 m) in elevation to Lake Superior over the final 2.2 miles (3.5 km) of its course.
The Alapahoochee River is a 14.4-mile-long (23.2 km) tributary of the Alapaha River in Georgia and Florida in the United States. Via the Alapaha and Suwannee rivers, its waters flow to the Gulf of Mexico.
The United States Geological Survey (USGS), formerly simply known as the Geological Survey, is a scientific agency of the United States government. The scientists of the USGS study the landscape of the United States, its natural resources, and the natural hazards that threaten it. The organization's work spans the disciplines of biology, geography, geology, and hydrology. The USGS is a fact-finding research organization with no regulatory responsibility. The agency was founded on March 3, 1879.

A discrete global grid (DGG) is a mosaic that covers the entire Earth's surface. Mathematically it is a space partitioning: it consists of a set of non-empty regions that form a partition of the Earth's surface. In a usual grid-modeling strategy, to simplify position calculations, each region is represented by a point, abstracting the grid as a set of region-points. Each region or region-point in the grid is called a cell.
References
- ↑ The National Map elevation information