
Fundamental analysis, in accounting and finance, is the analysis of a business's financial statements ; health; and competitors and markets. It also considers the overall state of the economy and factors including interest rates, production, earnings, employment, GDP, housing, manufacturing and management. There are two basic approaches that can be used: bottom up analysis and top down analysis. These terms are used to distinguish such analysis from other types of investment analysis, such as quantitative and technical.

In finance, equity is ownership of assets that may have debts or other liabilities attached to them. Equity is measured for accounting purposes by subtracting liabilities from the value of the assets. For example, if someone owns a car worth $24,000 and owes $10,000 on the loan used to buy the car, the difference of $14,000 is equity. Equity can apply to a single asset, such as a car or house, or to an entire business. A business that needs to start up or expand its operations can sell its equity in order to raise cash that does not have to be repaid on a set schedule.
In accounting, book value is the value of an asset according to its balance sheet account balance. For assets, the value is based on the original cost of the asset less any depreciation, amortization or impairment costs made against the asset. Traditionally, a company's book value is its total assets minus intangible assets and liabilities. However, in practice, depending on the source of the calculation, book value may variably include goodwill, intangible assets, or both. The value inherent in its workforce, part of the intellectual capital of a company, is always ignored. When intangible assets and goodwill are explicitly excluded, the metric is often specified to be "tangible book value".
Value investing is an investment paradigm that involves buying securities that appear underpriced by some form of fundamental analysis. The various forms of value investing derive from the investment philosophy first taught by Benjamin Graham and David Dodd at Columbia Business School in 1928, and subsequently developed in their 1934 text Security Analysis.
Market portfolio is a portfolio consisting of a weighted sum of every asset in the market, with weights in the proportions that they exist in the market, with the necessary assumption that these assets are infinitely divisible.
Market timing is the strategy of making buying or selling decisions of financial assets by attempting to predict future market price movements. The prediction may be based on an outlook of market or economic conditions resulting from technical or fundamental analysis. This is an investment strategy based on the outlook for an aggregate market rather than for a particular financial asset.
Business valuation is a process and a set of procedures used to estimate the economic value of an owner's interest in a business. Here various valuation techniques are used by financial market participants to determine the price they are willing to pay or receive to effect a sale of the business. In addition to estimating the selling price of a business, the same valuation tools are often used by business appraisers to resolve disputes related to estate and gift taxation, divorce litigation, allocate business purchase price among business assets, establish a formula for estimating the value of partners' ownership interest for buy-sell agreements, and many other business and legal purposes such as in shareholders deadlock, divorce litigation and estate contest.
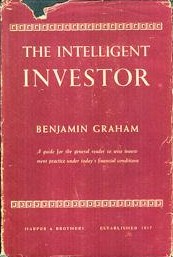
The Intelligent Investor by Benjamin Graham, first published in 1949, is a widely acclaimed book on value investing. The book provides strategies on how to successfully use value investing in the stock market. Historically, the book has been one of the most popular books on investing and Graham’s legacy remains.
Momentum investing is a system of buying stocks or other securities that have had high returns over the past three to twelve months, and selling those that have had poor returns over the same period.
Style investing is an investment approach in which securities are grouped into categories and portfolio allocation based on selection among styles rather than among individual securities. Style investors can make portfolio allocation decisions by placing their money in broad categories of assets, such as small-cap, value, low-volatility, or emerging markets. Some investors dynamically allocate across different styles and move funds back and forth between these styles depending on their expected performance.
Margin of safety is the difference between the intrinsic value of a stock and its market price.

The "Fed model" or "Fed Stock Valuation Model" (FSVM), is a disputed theory of equity valuation that compares the stock market's forward earnings yield to the nominal yield on long-term government bonds, and that the stock market – as a whole – is fairly valued, when the one-year forward-looking I/B/E/S earnings yield equals the 10-year nominal Treasury yield; deviations suggest over-or-under valuation.
Financial statement analysis is the process of reviewing and analyzing a company's financial statements to make better economic decisions to earn income in future. These statements include the income statement, balance sheet, statement of cash flows, notes to accounts and a statement of changes in equity. Financial statement analysis is a method or process involving specific techniques for evaluating risks, performance, financial health, and future prospects of an organization.

In finance, a stock index, or stock market index, is an index that measures a stock market, or a subset of the stock market, that helps investors compare current stock price levels with past prices to calculate market performance.
A period of financial distress occurs when the price of a company or an asset or an index of a set of assets in a market is declining with the danger of a sudden crash of value occurring, either because the company is experiencing increasing problems of cash flow or a deteriorating credit balance or because the price had become too high as a result of a speculative bubble that has now peaked.
The price-to-book ratio, or P/B ratio, is a financial ratio used to compare a company's current market value to its book value. The calculation can be performed in two ways, but the result should be the same. In the first way, the company's market capitalization can be divided by the company's total book value from its balance sheet. The second way, using per-share values, is to divide the company's current share price by the book value per share. It is also known as the market-to-book ratio and the price-to-equity ratio, and its inverse is called the book-to-market ratio.

In investing and finance, the low-volatility anomaly is the observation that low-volatility stocks have higher returns than high-volatility stocks in most markets studied. This is an example of a stock market anomaly since it contradicts the central prediction of many financial theories that taking higher risk must be compensated with higher returns.
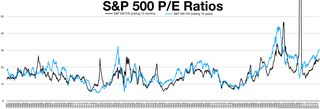
The cyclically adjusted price-to-earnings ratio, commonly known as CAPE, Shiller P/E, or P/E 10 ratio, is a valuation measure usually applied to the US S&P 500 equity market. It is defined as price divided by the average of ten years of earnings, adjusted for inflation. As such, it is principally used to assess likely future returns from equities over timescales of 10 to 20 years, with higher than average CAPE values implying lower than average long-term annual average returns.
Factor investing is an investment approach that involves targeting quantifiable firm characteristics or “factors” that can explain differences in stock returns. Security characteristics that may be included in a factor-based approach include size, low-volatility, value, momentum, asset growth, profitability, leverage, term and cost of carry.
Low-volatility investing is an investment style that buys stocks or securities with low volatility and avoids those with high volatility. This investment style exploits the low-volatility anomaly. According to financial theory risk and return should be positively related, however in practice this is not true. Low-volatility investors aim to achieve market-like returns, but with lower risk. This investment style is also referred to as minimum volatility, minimum variance, managed volatility, smart beta, defensive and conservative investing.