Related Research Articles
A prediction, or forecast, is a statement about a future event. They are often, but not always, based upon experience or knowledge. There is no universal agreement about the exact difference from "estimation"; different authors and disciplines ascribe different connotations.
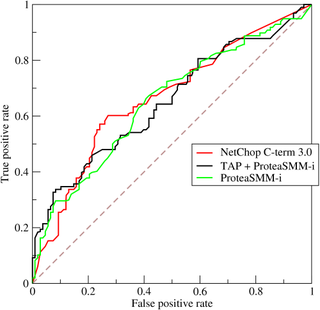
A receiver operating characteristic curve, or ROC curve, is a graphical plot that illustrates the diagnostic ability of a binary classifier system as its discrimination threshold is varied. The method was originally developed for operators of military radar receivers starting in 1941, which led to its name.
The Framingham Heart Study is a long-term, ongoing cardiovascular cohort study of residents of the city of Framingham, Massachusetts. The study began in 1948 with 5,209 adult subjects from Framingham, and is now on its third generation of participants. Prior to the study almost nothing was known about the epidemiology of hypertensive or arteriosclerotic cardiovascular disease. Much of the now-common knowledge concerning heart disease, such as the effects of diet, exercise, and common medications such as aspirin, is based on this longitudinal study. It is a project of the National Heart, Lung, and Blood Institute, in collaboration with Boston University. Various health professionals from the hospitals and universities of Greater Boston staff the project.
Reliability engineering is a sub-discipline of systems engineering that emphasizes the ability of equipment to function without failure. Reliability describes the ability of a system or component to function under stated conditions for a specified period of time. Reliability is closely related to availability, which is typically described as the ability of a component or system to function at a specified moment or interval of time.
Predictive medicine is a field of medicine that entails predicting the probability of disease and instituting preventive measures in order to either prevent the disease altogether or significantly decrease its impact upon the patient.

A medical test is a medical procedure performed to detect, diagnose, or monitor diseases, disease processes, susceptibility, or to determine a course of treatment. Medical tests such as, physical and visual exams, diagnostic imaging, genetic testing, chemical and cellular analysis, relating to clinical chemistry and molecular diagnostics, are typically performed in a medical setting.
A coronary CT calcium scan is a computed tomography (CT) scan of the heart for the assessment of severity of coronary artery disease. Specifically, it looks for calcium deposits in the coronary arteries that can narrow arteries and increase the risk of heart attack. This severity can be presented as Agatston score or coronary artery calcium (CAC) score. The CAC score is an independent marker of risk for cardiac events, cardiac mortality, and all-cause mortality. In addition, it provides additional prognostic information to other cardiovascular risk markers. A typical coronary CT calcium scan is done without the use of radiocontrast, but it can possibly be done from contrast-enhanced images as well, such as in coronary CT angiography.
A clinical prediction rule or clinical probability assessment is a type of algorithm to that includes a combination of medical sign, symptoms, and other findings in predicting the probability of a specific disease or outcome.
Quantification of Margins and Uncertainty (QMU) is a decision support methodology for complex technical decisions. QMU focuses on the identification, characterization, and analysis of performance thresholds and their associated margins for engineering systems that are evaluated under conditions of uncertainty, particularly when portions of those results are generated using computational modeling and simulation. QMU has traditionally been applied to complex systems where comprehensive experimental test data is not readily available and cannot be easily generated for either end-to-end system execution or for specific subsystems of interest. Examples of systems where QMU has been applied include nuclear weapons performance, qualification, and stockpile assessment. QMU focuses on characterizing in detail the various sources of uncertainty that exist in a model, thus allowing the uncertainty in the system response output variables to be well quantified. These sources are frequently described in terms of probability distributions to account for the stochastic nature of complex engineering systems. The characterization of uncertainty supports comparisons of design margins for key system performance metrics to the uncertainty associated with their calculation by the model. QMU supports risk-informed decision-making processes where computational simulation results provide one of several inputs to the decision-making authority. There is currently no standardized methodology across the simulation community for conducting QMU; the term is applied to a variety of different modeling and simulation techniques that focus on rigorously quantifying model uncertainty in order to support comparison to design margins.
In statistics, regression validation is the process of deciding whether the numerical results quantifying hypothesized relationships between variables, obtained from regression analysis, are acceptable as descriptions of the data. The validation process can involve analyzing the goodness of fit of the regression, analyzing whether the regression residuals are random, and checking whether the model's predictive performance deteriorates substantially when applied to data that were not used in model estimation.
Bankruptcy prediction is the art of predicting bankruptcy and various measures of financial distress of public firms. It is a vast area of finance and accounting research. The importance of the area is due in part to the relevance for creditors and investors in evaluating the likelihood that a firm may go bankrupt.
The Hosmer–Lemeshow test is a statistical test for goodness of fit for logistic regression models. It is used frequently in risk prediction models. The test assesses whether or not the observed event rates match expected event rates in subgroups of the model population. The Hosmer–Lemeshow test specifically identifies subgroups as the deciles of fitted risk values. Models for which expected and observed event rates in subgroups are similar are called well calibrated.
The Framingham Risk Score is a gender-specific algorithm used to estimate the 10-year cardiovascular risk of an individual. The Framingham Risk Score was first developed based on data obtained from the Framingham Heart Study, to estimate the 10-year risk of developing coronary heart disease. In order to assess the 10-year cardiovascular disease risk, cerebrovascular events, peripheral artery disease and heart failure were subsequently added as disease outcomes for the 2008 Framingham Risk Score, on top of coronary heart disease.
Renal angina is a clinical methodology to risk stratify patients for the development of persistent and severe acute kidney injury (AKI). The composite of risk factors and early signs of injury for AKI, renal angina is used as a clinical adjunct to help optimize the use of novel AKI biomarker testing. The term angina from Latin and from the Greek ẚnkhone (“strangling”) are utilized in the context of AKI to denote the development of injury and the choking off of kidney function. Unlike angina pectoris, commonly caused due to ischemia of the heart muscle secondary to coronary artery occlusion or vasospasm, renal angina carries no obvious physical symptomatology. Renal angina was derived as a conceptual framework to identify evolving AKI. Like acute coronary syndrome which precedes or is a sign of a heart attack, renal angina is used as a herald sign for a kidney attack. Detection of renal angina is performed by calculating the renal angina index.
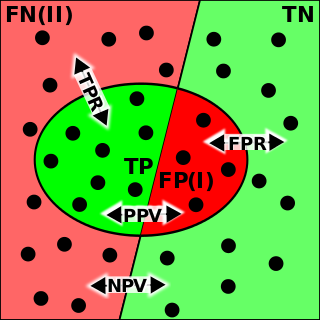
The evaluation of binary classifiers compares two methods of assigning a binary attribute, one of which is usually a standard method and the other is being investigated. There are many metrics that can be used to measure the performance of a classifier or predictor; different fields have different preferences for specific metrics due to different goals. For example, in medicine sensitivity and specificity are often used, while in computer science precision and recall are preferred. An important distinction is between metrics that are independent on the prevalence, and metrics that depend on the prevalence – both types are useful, but they have very different properties.
Predictive genomics is at the intersection of multiple disciplines: predictive medicine, personal genomics and translational bioinformatics. Specifically, predictive genomics deals with the future phenotypic outcomes via prediction in areas such as complex multifactorial diseases in humans. To date, the success of predictive genomics has been dependent on the genetic framework underlying these applications, typically explored in genome-wide association (GWA) studies. The identification of associated single-nucleotide polymorphisms underpin GWA studies in complex diseases that have ranged from Type 2 Diabetes (T2D), Age-related macular degeneration (AMD) and Crohn's disease.

In genetics, a polygenic score (PGS), also called a polygenic risk score (PRS), genetic risk score, or genome-wide score, is a number that summarises the estimated effect of many genetic variants on an individual's phenotype, typically calculated as a weighted sum of trait-associated alleles. It reflects an individual's estimated genetic predisposition for a given trait and can be used as a predictor for that trait. In other words, it gives an estimate of how likely an individual is to have a given trait only based on genetics, without taking environmental factors into account. Polygenic scores are widely used in animal breeding and plant breeding due to their efficacy in improving livestock breeding and crops. In humans, polygenic scores are typically generated from genome-wide association study (GWAS) data.

Land change models (LCMs) describe, project, and explain changes in and the dynamics of land use and land-cover. LCMs are a means of understanding ways that humans change the Earth's surface in the past, present, and future.
In machine learning, a given algorithm is said to be fair, or to have fairness if its results are independent of given variables, especially those considered sensitive, such as the traits of individuals which should not correlate with the outcome.
Decision curve analysis evaluates a predictor for an event as a probability threshold is varied, typically by showing a graphical plot of net benefit against threshold probability. By convention, the default strategies of assuming that all or no observations are positive are also plotted. Threshold probability is defined as the minimum probability of an event at which a decision-maker would take a given action, for instance, the probability of cancer at which a doctor would order a biopsy. A lower threshold probability implies a greater concern about the event, while a higher threshold implies greater concern about the action to be taken. Net benefit is a weighted combination of true and false positives, where the weight is derived from the threshold probability. The predictor could be a binary classifier, or a percentage risk from a prediction model, in which case a positive classification is defined by whether predicted probability is at least as great as the threshold probability.
References
- ↑ Leening MJG, Vedder MM, Witteman JCM, Pencina MJ, Steyerberg EW. Net reclassification improvement: computation, interpretation, and controversies: a literature review and clinician’s guide. Ann Intern Med. 2014;160(2):122-131.
- ↑ 1. Cook NR. Use and misuse of the receiver operating characteristic curve in risk prediction. Circulation. 2007;115(7):928-935.
- ↑ Pencina MJ, D’Agostino RB, Pencina KM, Janssens ACJW, Greenland P. Interpreting incremental value of markers added to risk prediction models. Am J Epidemiol. 2012;176(6):473-481.
- ↑ Steyerberg EW, Calster BV, Pencina MJ. Performance Measures for Prediction Models and Markers: Evaluation of Predictions and Classifications. Revista Española de Cardiología (English Edition). 2011;64(9):788-794
- ↑ Pencina MJ, D’Agostino RB, D’Agostino RB, Vasan RS. Evaluating the added predictive ability of a new marker: from area under the ROC curve to reclassification and beyond. Stat Med. 2008;27(2):157-172; discussion 207-212.
- ↑ Pencina, M.J., D'Agostino Sr, R.B. and Steyerberg, E.W., 2011. Extensions of net reclassification improvement calculations to measure usefulness of new biomarkers. Statistics in medicine, 30(1), pp.11-21.
- ↑ Pepe, M. S., Fan, J., Feng, Z., Gerds, T., & Hilden, J. (2015). The net reclassification index (NRI): a misleading measure of prediction improvement even with independent test data sets. Statistics in biosciences, 7(2), 282-295.
- ↑ Kundu S, Aulchenko YS, van Duijn CM, Janssens AC. PredictABEL: an R package for the assessment of risk prediction models. European journal of epidemiology. 2011 Apr;26(4):261-4.
- ↑ Uno, H. and Cai, T., 2013. survIDINRI: IDI and NRI for comparing competing risk prediction models with censored survival data. R. Package Version, p.1.