Omagh (District Electoral Area)

Last updated

Omagh
Fermanagh and Omagh District Council DEA constituency
Current constituency
Created1985
Seats7 (1985-2014)
6 (2014-)
Councillors
  •   Josephine Deehan (IND)
  •   Stephen Donnelly (APNI)
  •   Catherine Kelly (SF)
  •   Marty McColgan (SF)
  •   Barry McElduff (SF)
  •   Errol Thompson (DUP)
Omagh DEA within Fermanagh and Omagh Fermanagh and Omagh Omagh highlight.svg
Omagh DEA within Fermanagh and Omagh
Omagh Town DEA (1993-2014) within Omagh Omagh 1993 Omagh Town highlight.svg
Omagh Town DEA (1993-2014) within Omagh

Omagh is one of the seven district electoral areas (DEA) in Fermanagh and Omagh, Northern Ireland. [1] The district elects six members to Fermanagh and Omagh District Council and contains the wards of Camowen, Coolnagard, Dergmoney, Gortrush, Killyclogher and Strule. [2] Omagh forms part of the West Tyrone constituencies for the Northern Ireland Assembly and UK Parliament.

Contents

It was created for the 1985 local elections, replacing Omagh Area C which had existed since 1973. It was called Omagh Town until 2014, and originally contained seven wards (Camowen, Coolnagard, Dergmoney, Drumragh, Gortrush, Lisanelly and Strule). For the 2014 local elections it was reduced to six wards.

Councillors

ElectionCouncillor
(Party)
Councillor
(Party)
Councillor
(Party)
Councillor
(Party)
Councillor
(Party)
Councillor
(Party)
Councillor
(Party)
2023 Marty McColgan
(Sinn Féin)
Barry McElduff
(Sinn Féin)
Josephine Deehan
(Independent)/
(SDLP)
Stephen Donnelly
(Alliance)
Catherine Kelly
(Sinn Féin)
Errol Thompson
(DUP)
6 seats
2014–present
August 2021 Co-OptionAnn-Marie Fitzgerald
(Sinn Féin)
Matthew Bell
(UUP)
2019 Chris Smyth
(UUP)
March/April 2016 DefectionsMarty McColgan
(Sinn Féin)
Sorcha McAnespy
(Independent)/
(Sinn Féin)
Joanne Donnelly
(Independent)/
(SDLP)
2014
2011 Sean Begley
(Sinn Féin)
Patrick McGowan
(Independent)/
(SDLP)
Ross Hussey
(UUP)
Johnny McLaughlin
(Independent)/
(Labour Coalition)/
(SDLP)
2005 Marty McColgan
(Sinn Féin)
Clive McFarland
(DUP)
2001 Joe Byrne
(SDLP)
Reuben McKelvey
(UUP)
Oliver Gibson
(DUP)
1997 Francis Mackey
(Sinn Féin)
Vincent Campbell
(SDLP)
Ann Gormley
(Alliance)
1993 Joe Byrne
(SDLP)
Wilfred Breen
(UUP)
1989 Stanley Johnston
(DUP)
Stephen McKenna
(SDLP)
1985 David Aiken
(DUP)
Bernadette Grant
(SDLP)

2023 Election

2019: 2 x Sinn Féin, 1 x DUP, 1 x UUP, 1 x Alliance, 1 x Independent

2023: 3 x Sinn Féin, 1 x DUP, 1 x Alliance, 1 x Independent

2019–2023 Change: Sinn Féin gain from UUP

Omagh - 6 seats [3]
PartyCandidateFPv%Count
1234567
Sinn Féin Barry McElduff*20.22%1,342      
DUP Errol Thompson*17.15%1,138      
Sinn Féin Catherine Kelly 15.27%1,013      
Sinn Féin Marty McColgan11.65%7731,073.44     
Alliance Stephen Donnelly*13.14%872899.84 903.92 958.92   
Independent Josephine Deehan*7.07%469492.20 494.58 545.49 582.01 601.81 940.60
UUP Matthew Bell*7.37%489489.29 668.13 673.47 674.79 675.23 695.14
SDLP Brenda Mellon5.80%385410.81 412.34 437.67 520.61 561.97  
Independent Kathy Dunphy1.21%8085.22 85.90     
Socialist Party Amy Ferguson1.13%7576.74 77.08     
Electorate: 13,279  Valid: 6,636 (49.97%)  Spoilt: 103  Quota: 949  Turnout: 6,739 (50.75%)  

    2019 Election

    2014: 2 x Sinn Féin, 2 x SDLP, 1 x DUP, 1 x UUP

    2019: 2 x Sinn Féin, 1 x DUP, 1 x UUP, 1 x Alliance, 1 x Independent

    2014-2019 Change: Alliance and Independent gain from SDLP (two seats)

    Omagh - 6 seats [4]
    PartyCandidateFPv%Count
    1234567891011
    DUP Errol Thompson*15.24%970          
    Sinn Féin Barry McElduff 14.14%900900 903 914       
    Independent Josephine Deehan*11.44%728728.96 738.02 752.02 762.62 800.68 840.74 916.74   
    Alliance Stephen Donnelly9.68%616616.24 620.24 638.24 641.48 665.48 697.48 708.48 735.48 807.48 935.48
    UUP Chris Smyth* †9.95%633676.44 677.56 678.62 775.02 776.08 787.26 791.32 797.32 803.32 839.44
    Sinn Féin Ann-Marie Fitzgerald*9.26%589589 589 594 595 607 611 629 639 670 791
    Sinn Féin Marty McColgan*8.00%509509 511 520 520 530 536 550 554 604 643
    SDLP Lee Hawkes4.02%256256.18 257.18 262.18 263.24 271.24 285.3 292.3 491.36 532.36  
    Independent Sorcha McAnespy*3.05%194194.06 198.06 212.06 212.12 234.12 257.12 292.12 309.12   
    SDLP Jacinta McKeown4.05%258258.12 258.12 258.12 259.12 264.12 266.12 279.12    
    Aontú Margaret Swift2.86%182182 182 187 188.06 192.06 205.06     
    Green (NI) Susan Glass2.22%141141.24 144.3 151.3 155.42 165.54      
    Independent Joanne Donnelly*2.01%128128.3 135.3 146.36 146.36       
    TUV Charles Chittick1.81%115125.2 125.26 132.26        
    CISTA Barry Brown1.59%101101.24 109.24         
    Independent Will Convey0.68%4343.3          
    Electorate: 12,737  Valid: 6,363 (49.96%)  Spoilt: 98  Quota: 910  Turnout: 6,461 (50.73%)  

      2014 Election

      2011: 2 x Sinn Féin, 2 x Independent, 1 x SDLP, 1 x DUP, 1 x UUP

      2014: 2 x Sinn Féin, 2 x SDLP, 1 x DUP, 1 x UUP

      2011-2014 Change: SDLP gain from Independent, Independent loss due to the reduction of one seat

      Omagh - 6 seats [5]
      PartyCandidateFPv%Count
      1234567
      SDLP Josephine Deehan* ‡15.04%946      
      Sinn Féin Sorcha McAnespy* ‡14.82%932      
      DUP Errol Thompson*10.24%644644 644.6 664.6 664.78 1,094.78 
      UUP Chris Smyth*10.83%681685 686.4 752.5 752.5 851.5 
      SDLP Joanne Donnelly6.92%435453 519.6 701.9 708.92 731.51 835.51
      Sinn Féin Marty McColgan*11.80%742758 764 776.8 819.01 819.01 819.01
      Sinn Féin Catherine Kelly8.84%556565 571.9 592.1 623.15 625.25 625.25
      DUP Adele Crawford8.66%545545 545.7 576 576.36   
      Alliance Eric Bullick5.98%376396 403.6     
      Independent Gabrielle McAleer1.34%84      
      Electorate: 12,373  Valid: 5,941 (48.02%)  Spoilt: 153  Quota: 849  Turnout: 6,094 (49.25%)  

        2011 Election

        2005: 2 x Sinn Féin, 2 x Independent, 1 x DUP, 1 x UUP, 1 x SDLP

        2011: 2 x Sinn Féin, 2 x Independent, 1 x DUP, 1 x UUP, 1 x SDLP

        2005-2011 Change: No change

        Omagh Town - 7 seats [6]
        PartyCandidateFPv%Count
        123456789
        DUP Errol Thompson17.56%1,064        
        UUP Ross Hussey *15.29%926        
        Sinn Féin Sean Begley*13.04%790        
        SDLP Josephine Deehan*9.62%583613.36 628.54 638.76 761.76    
        Independent Patrick McGowan *8.85%536626.62 689.87 703.16 731.39 859.39   
        Independent Johnny McLaughlin*7.96%482544.56 569.63 576.32 587.93 725.24 801.24  
        Sinn Féin Sorcha McAnespy9.33%565565 565.46 567.46 586.46 612.45 614.45 625.45 648.97
        Sinn Féin Martin McColgan*9.62%583583 583 583 587 591.46 591.46 596.46 601.98
        Alliance Eric Bullick4.03%244321.74 365.21 449.8 462.63     
        SDLP Steven Brown3.38%205210.52 212.82 214.28      
        Alliance Victoria Geelan1.32%80116.8 131.75       
        Electorate: 10,851  Valid: 6,058 (55.83%)  Spoilt: 126  Quota: 758  Turnout: 6,184 (56.99%)  

          2005 Election

          2001: 2 x SDLP, 2 x Independent, 1 x Sinn Féin, 1 x DUP, 1 x UUP

          2005: 2 x Sinn Féin, 2 x Independent, 1 x SDLP, 1 x DUP, 1 x UUP

          2001-2005 Change: Sinn Féin gain from SDLP

          Omagh Town - 7 seats [7]
          PartyCandidateFPv%Count
          1234
          DUP Clive McFarland18.71%1,264   
          Sinn Féin Sean Begley*17.07%1,153   
          Independent Patrick McGowan *13.10%885   
          SDLP Josephine Deehan*12.76%862   
          UUP Ross Hussey 12.30%8311,213.68  
          Independent Johnny McLaughlin*9.49%641671.96 858.08 
          Sinn Féin Martin McColgan8.41%568568.72 569.08 832.11
          SDLP Joe Byrne*8.16%551553.16 596.72 641.67
          Electorate: 10,577  Valid: 6,755 (63.86%)  Spoilt: 177  Quota: 845  Turnout: 6,932 (65.54%)  

            2001 Election

            1997: 2 x SDLP, 1 x Sinn Féin, 1 x DUP, 1 x UUP, 1 x Alliance, 1 x Labour Coalition

            2001: 2 x SDLP, 2 x Independent, 1 x Sinn Féin, 1 x DUP, 1 x UUP

            1997-2001 Change: Independents (two seats) leave SDLP and Labour Coalition, SDLP gain from Alliance

            Omagh Town - 7 seats [8]
            PartyCandidateFPv%Count
            12345678
            Sinn Féin Sean Begley14.08%1,123       
            DUP Oliver Gibson *13.63%1,087       
            Independent Patrick McGowan *13.47%1,074       
            SDLP Joe Byrne *12.63%1,007       
            UUP Reuben McKelvey*7.70%614614 688 733.18 1,223.18   
            Independent Johnny McLaughlin*9.52%759764.17 813.39 817.44 875.04 1,021.74  
            SDLP Josephine Deehan7.89%629632.19 758.84 759.29 767.64 844.14 898.64 921.39
            Sinn Féin Paddy Gallagher9.57%763867.61 886.16 886.25 886.34 887.24 906.54 906.89
            UUP John Anderson6.92%552552 611 645.65     
            SDLP Vincent Campbell*2.23%178181.74       
            DUP Thomas McCordick2.14%171171       
            Independent Kevin Taylor0.24%1919.22       
            Electorate: 11,036  Valid: 7,976 (72.27%)  Spoilt: 222  Quota: 998  Turnout: 8,198 (74.28%)  

              1997 Election

              1993: 2 x SDLP, 1 x DUP, 1 x Sinn Féin, 1 x UUP, 1 x Alliance, 1 x Labour Coalition

              1997: 2 x SDLP, 1 x DUP, 1 x Sinn Féin, 1 x UUP, 1 x Alliance, 1 x Independent Labour

              1993-1997 Change: Independent Labour joins Labour Coalition

              Omagh Town - 7 seats [9]
              PartyCandidateFPv%Count
              12345678910
              Sinn Féin Francis Mackey*16.85%1,096         
              SDLP Patrick McGowan *16.60%1,080         
              DUP Oliver Gibson *11.48%747747 747 889      
              SDLP Vincent Campbell5.56%362365.64 450.64 450.64 450.64 729.92 846.38   
              Labour Coalition Johnny McLaughlin*8.76%570583 606 611.25 611.25 676.3 805.92 825.6  
              UUP Reuben McKelvey8.72%567567 567.75 577.75 584.35 584.35 585.87 585.87 806.22 806.46
              Alliance Ann Gormley*7.24%471474.64 498.14 499.14 500.24 545.24 584.11 595.87 606.12 616.44
              UUP William Oldcroft7.47%486486 486 498 506.25 507.25 508.25 508.97 609.82 610.3
              DUP Harry Cairns5.76%375375 375.25 434.25 492.55 492.8 493.8 493.8   
              Sinn Féin Patrick O'Hagan3.14%204456.46 464.71 464.96 464.96 492.06     
              SDLP Stephen McKenna4.75%309315.24 436.74 437.74 437.74      
              DUP Keith Mosgrove3.01%196196 196        
              Ulster Independence Sandra Jones0.65%4242 42.5        
              Electorate: 11,051  Valid: 6,505 (58.86%)  Spoilt: 180  Quota: 814  Turnout: 6,685 (60.49%)  

                1993 Election

                1989: 3 x SDLP, 2 x DUP, 1 x UUP, 1 x Sinn Féin

                1993: 2 x SDLP, 1 x DUP, 1 x UUP, 1 x Sinn Féin, 1 x Alliance, 1 x Independent Labour

                1989-1993 Change: Alliance gain from DUP, Independent Labour leaves SDLP

                Omagh Town - 7 seats [10]
                PartyCandidateFPv%Count
                123456789
                DUP Oliver Gibson *14.83%995        
                SDLP Patrick McGowan *14.01%940        
                Independent Labour Johnny McLaughlin*13.73%921        
                UUP Wilfred Breen*12.05%808835.36 839.36      
                Alliance Ann Gormley7.50%503504.12 516.12 528 547.03 771.1 837.92 878.92 
                Sinn Féin Francis Mackey*12.03%807807 811 815.62 835.53 837.64 838.75 863.75 
                SDLP Joe Byrne 6.41%430430.32 435.32 461.72 470.74 477.83 480.27 751.07 768.07
                DUP Ivan Burnside5.81%390498.48 499.48 499.48 501.46 506.46 693.24 693.35 693.35
                SDLP Stephen McKenna*4.68%314314.32 327.32 378.58 401.46 404.28 407.6   
                UUP Reuben McKelvey4.04%271286.52 289.52 290.4 293.26 321.23    
                Alliance Ethne McClelland4.10%275276.76 279.76 282.29 286.03     
                Workers' Party Hugh Mullin0.81%5454        
                Electorate: 10,799  Valid: 6,708 (62.12%)  Spoilt: 179  Quota: 839  Turnout: 6,887 (63.77%)  

                  1989 Election

                  1985: 2 x SDLP, 2 x DUP, 1 x UUP, 1 x Sinn Féin, 1 x Independent Labour

                  1989: 3 x SDLP, 2 x DUP, 1 x UUP, 1 x Sinn Féin

                  1985-1989 Change: Independent Labour joins SDLP

                  Omagh Town - 7 seats [11]
                  PartyCandidateFPv%Count
                  12345678910
                  DUP Oliver Gibson *17.39%1,058         
                  SDLP Johnny McLaughlin*13.48%820         
                  UUP Wilfred Breen*12.10%736792.84        
                  SDLP Patrick McGowan *12.39%754754.84 771.57       
                  Sinn Féin Francis Mackey*11.44%696696.28 702.3 702.3 702.3 823.3    
                  SDLP Stephen McKenna*5.42%330330 348.48 348.64 354.71 358.99 358.99 372.99 613.23 771.23
                  DUP Stanley Johnston4.28%260464.4 464.47 481.27 481.43 481.43 679.13 679.13 690.25 700.09
                  Alliance Patrick Bogan5.01%305305.56 306.47 306.95 398.25 398.32 418.76 419.76 447.04 519.86
                  Workers' Party James Doody5.51%335336.12 341.23 341.23 344.65 348.72 358.16 369.16 394.79  
                  SDLP Arthur Breen5.34%325325.84 329.48 329.8 332.8 334.94 340.5 341.5   
                  UUP Rachel Hussey3.42%208234.32 234.6 247.4 252.4 252.4     
                  Sinn Féin Colm Grimes2.35%143143 144.05 144.05 144.05      
                  Alliance Eric Bullick1.89%115116.12 116.54 117.02       
                  Electorate: 9,451  Valid: 6,085 (64.38%)  Spoilt: 179  Quota: 761  Turnout: 6,264 (66.28%)  

                    1985 Election

                    1985: 2 x SDLP, 2 x DUP, 1 x Sinn Féin, 1 x UUP, 1 x Independent Labour

                    Omagh Town - 7 seats [12]
                    PartyCandidateFPv%Count
                    12345678910111213
                    Sinn Féin Francis Mackey18.74%1,213            
                    DUP Oliver Gibson *13.10%848            
                    Independent Labour Johnny McLaughlin12.03%779949.04           
                    SDLP Bernadette Grant*9.05%586642.55 674.53 674.57 676.96 677.04 682.43 710.76 747.43 1,002.43   
                    UUP Wilfred Breen7.15%463465.73 466.12 467.92 468.92 474.48 479.48 482.48 484.65 485.69 485.69 839.69 
                    SDLP Stephen McKenna*6.50%421448.69 459.22 459.22 469.22 469.22 469.22 503.95 541.06 624.05 793.34 796.12 796.39
                    DUP David Aiken7.99%517517 517 534.16 534.16 633.48 636.52 637.91 637.91 639.95 640.76 686.92 710.68
                    Alliance Aidan Lagan*5.78%374389.21 404.42 404.7 432.09 432.09 555.48 599.03 624.78 663.63 683.88 703.04 708.08
                    UUP Thomas Strain6.21%402402 403.95 406.27 407.27 415.71 428.83 430.22 431.61 441.04 441.04   
                    SDLP Arthur Breen5.34%346362.77 369.01 369.13 374.52 375.52 377.52 403.98 428.68     
                    Irish Independence James Sweeney1.16%75156.12 206.04 206.08 206.08 206.08 206.08 217.54      
                    Workers' Party Hugh Gormley2.21%143166.01 185.51 185.55 189.33 189.41 189.8       
                    Alliance Richard Hinds1.99%129129.78 130.17 130.33 151.33 154.33        
                    DUP Raymond Farrell1.62%105105 105 116.64 118.64         
                    Alliance Dermot McCormick1.13%7374.95 76.51 76.51          
                    Electorate: 9,554  Valid: 6,474 (67.76%)  Spoilt: 124  Quota: 810  Turnout: 6,598 (69.06%)  

                      Related Research Articles

                      <span class="mw-page-title-main">Castle (District Electoral Area)</span> District Electoral Area in Belfast, Northern Ireland

                      Castle is one of the ten district electoral areas in Belfast, Northern Ireland. Located in the north of the city, the district elects six members to Belfast City Council and contains the wards of Bellevue, Cavehill, Chichester Park, Duncairn, Fortwilliam and Innisfayle. Castle, along with Oldpark district and parts of the Court district and Newtownabbey Borough Council, forms the Belfast North constituency for the Northern Ireland Assembly and UK Parliament. The district is bounded to the east by the Victoria Channel, to the north by Newtownabbey Borough Council and Belfast Lough, to the south by North Street and to the west by the Cavehill Road.

                      <span class="mw-page-title-main">2014 Fermanagh and Omagh District Council election</span> 2014 Northern Irish local government election

                      The first election to Fermanagh and Omagh District Council, part of the Northern Ireland local elections on 22 May 2014, returned 40 members to the newly-formed council via Single Transferable Vote.

                      <span class="mw-page-title-main">2011 Fermanagh District Council election</span> Local government election in Northern Ireland

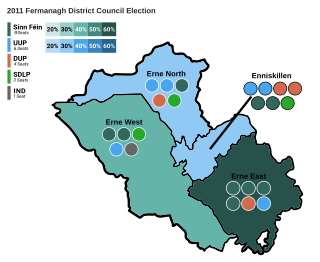
                      Elections to Fermanagh District Council were held on 5 May 2011 on the same day as the other Northern Irish local government elections. The election used four district electoral areas to elect a total of 23 councillors.

                      <span class="mw-page-title-main">2019 Fermanagh and Omagh District Council election</span> 2019 Northern Irish local government election

                      Elections took place for Fermanagh and Omagh District Council on 2 May 2019, part of that year's local elections. 40 Councillors were elected via STV.

                      Elections to Omagh District Council were held on 7 June 2001 on the same day as the other Northern Irish local government elections. The election used three district electoral areas to elect a total of 21 councillors.

                      Elections to Omagh District Council were held on 21 May 1997 on the same day as the other Northern Irish local government elections. The election used three district electoral areas to elect a total of 21 councillors.

                      Elections to Omagh District Council were held on 19 May 1993 on the same day as the other Northern Irish local government elections. The election used three district electoral areas to elect a total of 21 councillors.

                      Elections to Omagh District Council were held on 17 May 1989 on the same day as the other Northern Irish local government elections. The election used three district electoral areas to elect a total of 21 councillors.

                      <span class="mw-page-title-main">2023 Fermanagh and Omagh District Council election</span> Local election in Northern Ireland, UK

                      The 2023 election to Fermanagh and Omagh District Council was held on 18 May 2023, alongside other local elections in Northern Ireland, two weeks after local elections in England. The Northern Ireland elections were delayed by 2 weeks to avoid overlapping with the coronation of King Charles III.

                      Antrim Line was one of the district electoral areas in Newtownabbey, Northern Ireland which existed from 1985 to 2014, one of five DEAs until 1993 and one of four DEAs until 2014. The district elected five members to Newtownabbey Borough Council until 1993 and seven members until 2014, and formed part of the South Antrim constituencies for the Northern Ireland Assembly and UK Parliament and part of the Belfast North constituencies for the Northern Ireland Assembly and UK Parliament.

                      <span class="mw-page-title-main">Antrim South East (District Electoral Area)</span> District electoral areas in Antrim, Northern Ireland

                      Antrim South East was one of the three district electoral areas in Antrim, Northern Ireland which existed from 1985 to 2014. The district elected seven members to Antrim Borough Council and formed part of the South Antrim constituencies for the Northern Ireland Assembly and UK Parliament.

                      <span class="mw-page-title-main">Newcastle (District Electoral Area)</span> District electoral areas in Down, Northern Ireland

                      Newcastle was one of the four district electoral areas in Down, Northern Ireland which existed from 1985 to 2014. The district elected six members to Down District Council, and formed part of the South Down constituencies for the Northern Ireland Assembly and UK Parliament.

                      <span class="mw-page-title-main">Clogher Valley (District Electoral Area)</span> District electoral area in Northern Ireland

                      Clogher Valley is one of the seven district electoral areas (DEA) in Mid Ulster, Northern Ireland. The district elects six members to Mid Ulster District Council and contains the wards of Augher and Clogher, Aughnacloy, Ballygawley, Caledon, Castlecaulfield and Fivemiletown. Clogher Valley forms part of the Fermanagh and South Tyrone constituencies for the Northern Ireland Assembly and UK Parliament.

                      <span class="mw-page-title-main">Dungannon (District Electoral Area)</span> District electoral area in Northern Ireland

                      Dungannon is one of the seven district electoral areas (DEA) in Mid Ulster, Northern Ireland. The district elects six members to Mid Ulster District Council and contains the wards of Ballysaggart, Killyman, Killymeal, Moy, Moygashel and Mullaghmore. Dungannon forms part of the Fermanagh and South Tyrone constituencies for the Northern Ireland Assembly and UK Parliament.

                      <span class="mw-page-title-main">West Tyrone (District Electoral Area)</span> District electoral area in Northern Ireland

                      West Tyrone is one of the seven district electoral areas (DEA) in Fermanagh and Omagh, Northern Ireland. The district elects six members to Fermanagh and Omagh District Council and contains the wards of Dromore, Drumquin, Fairy Water, Fintona, Newtownsaville and Trillick. Omagh forms part of the West Tyrone constituencies for the Northern Ireland Assembly and UK Parliament.

                      <span class="mw-page-title-main">Mid Tyrone (District Electoral Area)</span> District electoral area in Northern Ireland

                      Mid Tyrone is one of the seven district electoral areas (DEA) in Fermanagh and Omagh, Northern Ireland. The district elects six members to Fermanagh and Omagh District Council and contains the wards of Beragh, Drumnakilly, Gortin, Owenkillew, Sixmilecross and Termon. Omagh forms part of the West Tyrone constituencies for the Northern Ireland Assembly and UK Parliament.

                      <span class="mw-page-title-main">Enniskillen (District Electoral Area)</span> District electoral area in Northern Ireland

                      Enniskillen is one of the seven district electoral areas (DEA) in Fermanagh and Omagh, Northern Ireland. The district elects six members to Fermanagh and Omagh District Council and contains the wards of Castlecoole, Erne, Lisbellaw, Lisnarrick, Portora and Rossory. Enniskillen forms part of the Fermanagh and South Tyrone constituencies for the Northern Ireland Assembly and UK Parliament.

                      <span class="mw-page-title-main">Erne East (District Electoral Area)</span> District electoral area in Northern Ireland

                      Erne East is one of the seven district electoral areas (DEA) in Fermanagh and Omagh, Northern Ireland. The district elects six members to Fermanagh and Omagh District Council and contains the wards of Brookeborough, Donagh, Lisnaskea, Maguiresbridge, Newtownbutler and Rosslea. Erne East forms part of the Fermanagh and South Tyrone constituencies for the Northern Ireland Assembly and UK Parliament.

                      <span class="mw-page-title-main">Erne West (District Electoral Area)</span> District electoral area in Northern Ireland

                      Erne West is one of the seven district electoral areas (DEA) in Fermanagh and Omagh, Northern Ireland. The district elects five members to Fermanagh and Omagh District Council and contains the wards of Belcoo and Garrison, Boho, Cleenish and Letterbreen, Derrygonnelly, Derrylin and Florence Court and Kinawley. Erne West forms part of the Fermanagh and South Tyrone constituencies for the Northern Ireland Assembly and UK Parliament.

                      <span class="mw-page-title-main">Glenelly (District Electoral Area)</span> District electoral areas in Strabane, Northern Ireland

                      Glenelly was one of the three district electoral areas in Strabane, Northern Ireland which existed from 1985 to 2014. The district elected five members to Strabane District Council, and formed part of the West Tyrone constituencies for the Northern Ireland Assembly and UK Parliament.

                      References

                      1. Final Northern Ireland super council recommendations, BBC News, 13 December 2013, accessed 24 May 2014
                      2. "Fermanagh and Omagh District Council". www.ark.ac.uk. Retrieved 10 July 2023.
                      3. "Local Council Elections 2023 - Results". EONI. Retrieved 8 July 2023.
                      4. "Local Council Elections 2019 - Results by Stage". 2 May 2019. Retrieved 24 January 2022.
                      5. "Local Council Elections 2014 - Results by Stage" . Retrieved 25 January 2022.
                      6. "Omagh Town Result Sheet" (PDF). EONI. Retrieved 14 August 2021.
                      7. "Local Government Results 2005". EONI. Retrieved 9 August 2021.
                      8. "Local Government Results 2001". EONI. Retrieved 14 August 2021.
                      9. "Local Government Results 1997". EONI. Retrieved 15 August 2021.
                      10. "Local Government Results 1993". EONI. Retrieved 15 August 2021.
                      11. "Local Government Results 1989". EONI. Retrieved 15 August 2021.
                      12. "Local Government Results 1985". EONI. Retrieved 15 August 2021.