Graphical summary
By party
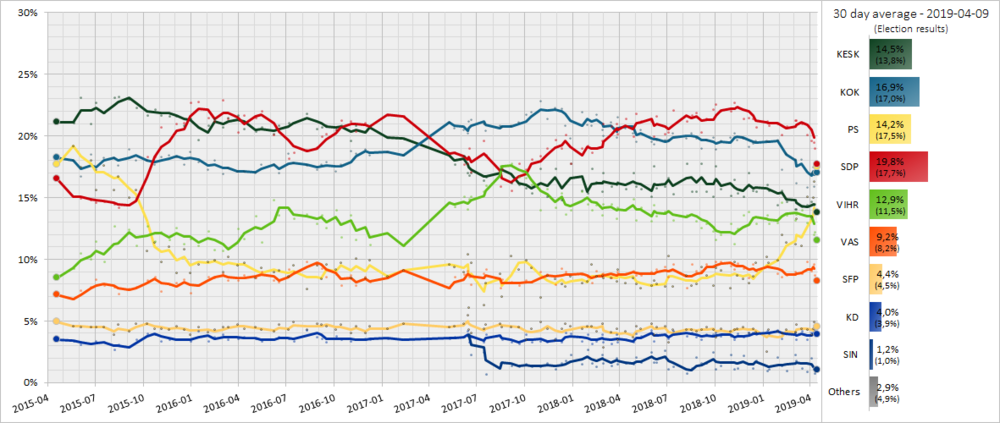
In the run up to the 2019 parliamentary elections in Finland, various organizations carry out opinion polling to gauge voting intention in Finland. Results of such polls are displayed in this article.
The date range for these opinion polls are from the previous parliamentary election, held on 19 April 2015, to the present day.
Poll results are listed in the table below in reverse chronological order, showing the most recent first. The highest percentage figure in each poll is displayed in bold, and the background shaded in the leading party's colour. In the instance that there is a tie, then no figure is shaded. The table uses the date the survey's fieldwork was done, as opposed to the date of publication. However, if that date is unknown, the date of publication will be given instead.
The Sipilä Cabinet is composed of the top three parties from the previous election: Centre (Kesk), National Coalition (Kok) and Finns (PS) parties. But after the split of the Finns Party, Blue Reform (Sin) took the party's place in the Sipilä Cabinet.
| Date | Polling Firm | KESK | KOK | PS | SDP | VIHR | VAS | SFP | KD | SIN | Others | Lead | Gov. | Opp. |
|---|---|---|---|---|---|---|---|---|---|---|---|---|---|---|
| Election result (14 Apr) | Ministry of Justice | 13.8 | 17.0 | 17.5 | 17.7 | 11.5 | 8.2 | 4.5 | 3.9 | 1.0 | 4.9 | 0.2 | (31.8) | (63.3) |
| 1–9 Apr | Taloustutkimus | 14.5 | 15.9 | 16.3 | 19.0 | 12.2 | 8.7 | 4.9 | 4.3 | 0.8 | 3.4 | 2.7 | (31.2) | (65.4) |
| 3–7 Apr | Kantar TNS | 14.4 | 17.5 | 15.0 | 19.5 | 12.0 | 9.6 | 4.4 | 4.1 | 1.1 | 2.4 | 2.0 | (33.0) | (64.4) |
| 25 Mar–3 Apr | Tietoykkönen | 14.7 | 17.0 | 13.4 | 19.6 | 13.3 | 9.1 | 3.9 | 4.1 | 2.0 | 2.9 | 2.6 | (33.7) | (63.4) |
| 6 Mar–26 Mar | Taloustutkimus | 14.4 | 15.8 | 15.1 | 20.1 | 13.0 | 9.8 | 4.3 | 3.5 | 0.9 | 3.1 | 4.3 | (31.1) | (65.8) |
| 18 Feb–15 Mar | Kantar TNS | 14.3 | 18.1 | 11.1 | 21.0 | 14.0 | 8.9 | 4.4 | 4.2 | 1.2 | 2.8 | 2.9 | (33.6) | (63.6) |
| 6 Feb–5 Mar | Taloustutkimus | 14.1 | 16.2 | 13.3 | 21.3 | 13.7 | 8.9 | 4.7 | 3.5 | 1.8 | 2.5 | 5.1 | 32.1 | 65.4 |
| 18 Feb–3 Mar | Tietoykkönen | 14.1 | 18.1 | 11.2 | 21.3 | 13.2 | 9.0 | 4.1 | 4.1 | 2.3 | 2.6 | 3.2 | 34.5 | 62.9 |
| 14 Jan–14 Feb | Kantar TNS | 14.7 | 18.6 | 11.4 | 20.8 | 13.6 | 8.7 | 4.3 | 4.0 | 1.0 | 2.9 | 2.2 | 34.3 | 62.8 |
| 14 Jan–5 Feb | Taloustutkimus | 15.6 | 17.3 | 12.0 | 20.1 | 14.6 | 8.6 | 4.0 | 3.6 | 1.4 | 2.7 | 2.8 | 34.3 | 62.9 |
| 14–28 Jan | Tietoykkönen | 14.4 | 19.7 | 9.9 | 21.0 | 13.0 | 8.9 | 4.2 | 4.3 | 2.1 | 2.5 | 1.3 | 36.2 | 61.3 |
| 13 Dec–11 Jan | Kantar TNS | 15.6 | 19.5 | 9.7 | 20.9 | 12.9 | 9.4 | 4.3 | 4.0 | 1.1 | 2.6 | 1.4 | 36.2 | 61.2 |
| 10 Dec–8 Jan | Taloustutkimus | 16.1 | 19.6 | 10.2 | 21.2 | 13.6 | 9.5 | 2.5 | 4.2 | 1.0 | 2.1 | 1.6 | 36.7 | 61.2 |
| 2018 | ||||||||||||||
| 5–18 Dec | Tietoykkönen | 15.5 | 19.6 | 9.7 | 20.7 | 12.9 | 9.1 | 4.1 | 3.9 | 1.8 | 2.7 | 1.1 | 36.9 | 60.4 |
| 13 Nov–12 Dec | Kantar TNS | 15.6 | 19.4 | 8.6 | 21.4 | 13.4 | 9.6 | 4.4 | 4.1 | 1.2 | 2.3 | 2.0 | 36.2 | 61.5 |
| 12 Nov–4 Dec | Taloustutkimus | 17.0 | 19.1 | 8.1 | 21.5 | 13.9 | 8.5 | 4.0 | 4.1 | 1.5 | 2.3 | 2.4 | 37.6 | 60.1 |
| 14–23 Nov | Tietoykkönen | 15.1 | 19.8 | 8.4 | 21.4 | 13.6 | 9.3 | 4.5 | 3.7 | 2.2 | 2.0 | 1.6 | 37.1 | 60.9 |
| 15 Oct–12 Nov | Kantar TNS | 15.4 | 19.7 | 8.7 | 22.4 | 12.5 | 9.7 | 4.4 | 4.0 | 1.2 | 2.0 | 2.7 | 36.3 | 61.7 |
| 3 Oct–6 Nov | Taloustutkimus | 16.5 | 20.2 | 9.8 | 22.7 | 11.3 | 9.2 | 4.3 | 3.5 | 1.1 | 1.4 | 2.5 | 37.8 | 60.8 |
| 12–30 Oct | Tietoykkönen | 15.2 | 19.9 | 7.7 | 22.0 | 12.9 | 9.5 | 4.2 | 3.8 | 2.3 | 2.5 | 2.1 | 37.4 | 60.1 |
| 17 Sep–11 Oct | Kantar TNS | 15.7 | 19.6 | 9.1 | 22.0 | 12.0 | 9.8 | 4.4 | 3.8 | 1.4 | 2.2 | 2.4 | 36.7 | 61.1 |
| 10 Sep–2 Oct | Taloustutkimus | 17.6 | 18.9 | 9.3 | 22.6 | 11.6 | 9.8 | 3.7 | 4.1 | 1.1 | 1.3 | 3.7 | 37.6 | 61.1 |
| 14–27 Sep | Tietoykkönen | 15.1 | 19.9 | 7.9 | 22.2 | 12.3 | 9.5 | 4.3 | 3.9 | 2.5 | 2.4 | 2.3 | 37.5 | 60.1 |
| 20 Aug–14 Sep | Kantar TNS | 15.5 | 19.7 | 8.7 | 21.4 | 12.9 | 9.6 | 4.5 | 3.9 | 1.6 | 2.2 | 1.7 | 36.8 | 61.0 |
| 13 Aug–4 Sep | Taloustutkimus | 17.8 | 19.0 | 9.4 | 20.3 | 12.6 | 9.1 | 4.3 | 3.5 | 1.6 | 2.4 | 1.3 | 38.4 | 59.2 |
| 13–25 Aug | Tietoykkönen | 15.5 | 19.8 | 8.0 | 21.9 | 13.1 | 9.1 | 4.2 | 3.7 | 2.1 | 2.6 | 2.1 | 37.4 | 60.0 |
| 16 Jul–16 Aug | Kantar TNS | 15.5 | 20.2 | 7.9 | 21.7 | 13.7 | 9.6 | 4.3 | 4.1 | 1.2 | 2.0 | 1.5 | 36.9 | 61.3 |
| 9 Jul–7 Aug | Taloustutkimus | 17.8 | 19.8 | 8.7 | 21.2 | 13.6 | 7.7 | 4.3 | 3.8 | 0.8 | 2.3 | 1.4 | 38.4 | 59.3 |
| 11 Jun–12 Jul | Kantar TNS | 15.3 | 20.2 | 7.8 | 22.1 | 13.2 | 9.6 | 4.3 | 4.2 | 1.3 | 2.0 | 1.9 | 36.8 | 61.2 |
| 6 Jun–3 Jul | Taloustutkimus | 16.6 | 19.7 | 10.3 | 20.3 | 13.9 | 8.6 | 3.3 | 3.6 | 1.1 | 2.6 | 0.6 | 37.4 | 60.0 |
| 6–26 Jun | Tietoykkönen | 15.9 | 19.7 | 7.8 | 20.2 | 13.9 | 9.4 | 4.6 | 3.9 | 2.6 | 2.0 | 0.5 | 38.2 | 59.8 |
| 14 May–10 Jun | Kantar TNS | 15.8 | 19.7 | 8.0 | 21.6 | 13.5 | 9.2 | 4.5 | 3.9 | 1.7 | 2.1 | 1.9 | 37.3 | 60.7 |
| 2 May–5 Jun | Taloustutkimus | 17.6 | 19.3 | 8.3 | 20.0 | 14.4 | 8.9 | 3.9 | 3.4 | 1.7 | 2.5 | 0.7 | 38.6 | 58.9 |
| 18–31 May | Tietoykkönen | 15.1 | 19.5 | 7.9 | 21.2 | 13.1 | 9.0 | 4.8 | 4.3 | 2.5 | 2.6 | 1.7 | 37.1 | 60.3 |
| 16 Apr–11 May | Kantar TNS | 15.7 | 20.5 | 7.7 | 21.2 | 14.2 | 8.7 | 4.4 | 3.8 | 1.7 | 2.1 | 0.7 | 37.9 | 60.0 |
| 19 Apr–2 May | Tietoykkönen | 15.9 | 19.5 | 8.0 | 21.8 | 13.2 | 8.7 | 4.6 | 4.0 | 2.1 | 2.2 | 2.3 | 37.5 | 60.3 |
| 3–26 Apr | Taloustutkimus | 17.0 | 20.2 | 8.5 | 20.0 | 14.9 | 9.1 | 3.7 | 3.3 | 1.5 | 1.8 | 0.2 | 38.7 | 59.5 |
| 19 Mar–12 Apr | Kantar TNS | 15.7 | 20.6 | 8.1 | 21.4 | 14.0 | 8.9 | 4.2 | 3.5 | 1.6 | 2.0 | 0.8 | 37.9 | 60.1 |
| 1–27 Mar | Taloustutkimus | 16.3 | 21.5 | 9.2 | 20.2 | 14.2 | 9.0 | 3.5 | 3.3 | 1.5 | 1.3 | 1.3 | 39.3 | 59.4 |
| 16–26 Mar | Tietoykkönen | 16.1 | 19.9 | 8.2 | 21.0 | 13.3 | 8.7 | 4.4 | 3.9 | 2.0 | 2.5 | 1.1 | 38.0 | 59.5 |
| 19 Feb–15 Mar | Kantar TNS | 15.9 | 21.1 | 8.5 | 20.8 | 14.5 | 8.5 | 4.1 | 3.2 | 1.4 | 2.0 | 0.3 | 38.4 | 59.6 |
| 7–28 Feb | Taloustutkimus | 17.0 | 20.0 | 8.5 | 21.0 | 14.5 | 8.9 | 2.9 | 3.3 | 1.6 | 2.3 | 1.0 | 38.6 | 59.1 |
| 14–26 Feb | Tietoykkönen | 15.5 | 20.5 | 8.7 | 19.6 | 13.6 | 8.8 | 4.8 | 3.9 | 2.3 | 2.3 | 0.9 | 38.3 | 59.4 |
| 22 Jan–15 Feb | Kantar TNS | 16.3 | 21.7 | 8.6 | 19.0 | 14.4 | 9.1 | 4.2 | 3.4 | 1.3 | 2.0 | 2.7 | 39.3 | 58.7 |
| 28 Dec–6 Feb | Taloustutkimus | 17.4 | 20.8 | 9.6 | 18.7 | 14.0 | 8.1 | 4.6 | 3.2 | 1.6 | 2.0 | 2.1 | 39.8 | 58.2 |
| 19–29 Jan | Tietoykkönen | 15.4 | 20.9 | 8.2 | 19.2 | 14.5 | 8.6 | 4.6 | 3.9 | 2.7 | 2.0 | 1.7 | 39.0 | 59.0 |
| 12 Dec–18 Jan | Kantar TNS | 15.6 | 21.9 | 8.1 | 19.0 | 15.5 | 8.8 | 4.4 | 3.4 | 1.5 | 1.8 | 2.9 | 39.0 | 59.2 |
| 2017 | ||||||||||||||
| 29 Nov–27 Dec | Taloustutkimus | 17.8 | 19.8 | 8.6 | 17.8 | 14.0 | 8.8 | 4.6 | 4.0 | 2.3 | 2.3 | 2.0 | 39.9 | 57.8 |
| 8–18 Dec | Tietoykkönen | 16.2 | 20.8 | 7.8 | 20.1 | 13.7 | 9.0 | 4.8 | 4.1 | 1.8 | 1.7 | 0.7 | 38.7 | 59.5 |
| 14 Nov–10 Dec | Kantar TNS | 14.8 | 22.2 | 8.0 | 19.0 | 15.4 | 9.3 | 4.4 | 3.3 | 1.6 | 2.0 | 3.2 | 38.6 | 59.4 |
| 1–28 Nov | Taloustutkimus | 17.4 | 22.3 | 8.4 | 19.7 | 14.2 | 8.0 | 3.5 | 3.6 | 1.1 | 1.8 | 2.6 | 40.8 | 57.4 |
| 16 Oct–13 Nov | Kantar TNS | 15.1 | 21.4 | 8.7 | 19.0 | 15.7 | 8.8 | 4.4 | 3.3 | 1.6 | 2.0 | 2.4 | 38.1 | 59.9 |
| 4–31 Oct | Taloustutkimus | 17.4 | 22.8 | 6.9 | 18.4 | 14.0 | 9.0 | 4.9 | 3.4 | 1.3 | 1.9 | 4.4 | 41.5 | 56.6 |
| 18 Sep–14 Oct | Kantar TNS | 15.4 | 21.9 | 9.3 | 18.1 | 16.1 | 8.2 | 4.4 | 3.3 | 1.3 | 2.0 | 3.8 | 38.6 | 59.4 |
| 11 Sep–3 Oct | Taloustutkimus | 15.8 | 21.7 | 9.9 | 17.3 | 16.6 | 8.3 | 3.5 | 3.9 | 1.5 | 1.5 | 4.4 | 39.0 | 59.5 |
| 21 Aug–19 Sep | Kantar TNS | 16.1 | 21.1 | 9.2 | 17.8 | 16.7 | 7.9 | 4.5 | 3.2 | 1.3 | 2.2 | 3.3 | 38.5 | 59.3 |
| 21 Aug–5 Sep | Taloustutkimus | 16.2 | 20.8 | 10.3 | 15.6 | 17.8 | 8.2 | 4.5 | 3.3 | 1.4 | 1.9 | 3.0 | 38.4 | 59.7 |
| 17 Jul–18 Aug | Kantar TNS | 17.3 | 20.7 | 7.0 | 17.3 | 17.5 | 8.4 | 4.5 | 3.5 | 1.7 | 2.1 | 3.2 | 39.7 | 58.2 |
| 24 Jul–15 Aug | Taloustutkimus | 17.3 | 20.8 | 8.8 | 15.9 | 17.6 | 7.7 | 4.8 | 3.7 | 1.6 | 1.8 | 3.2 | 39.7 | 58.5 |
| 26 Jun–18 Jul | Taloustutkimus | 16.7 | 20.4 | 8.1 | 18.5 | 16.0 | 9.2 | 4.7 | 3.9 | 0.7 | 1.8 | 1.9 | 37.8 | 60.4 |
| 19 Jun–14 Jul | Kantar TNS | 16.4 | 21.0 | 6.3 | 19.6 | 15.5 | 8.9 | 4.4 | 3.3 | 2.5 | 2.1 | 1.4 | 39.9 | 58.0 |
| 13–20 Jun | Taloustutkimus | 17.0 | 21.3 | 9.7 | 17.1 | 15.1 | 8.0 | 4.0 | 3.7 | 2.3 | 1.8 | 4.2 | 40.6 | 57.6 |
| 22 May–16 Jun | Kantar TNS | 16.8 | 21.2 | 6.1 | 19.0 | 14.9 | 8.6 | 4.3 | 3.3 | 3.9 | 1.9 | 2.2 | 41.9 | 56.2 |
| 12 Jun–13 Jun | Tietoykkönen | 17.0 | 20.2 | 10.4 | 17.8 | 14.1 | 9.1 | 5.5 | 4.2 | – | 1.7 | 2.4 | 47.6 | 50.7 |
| 10 May–6 Jun | Taloustutkimus | 18.4 | 20.5 | 9.0 | 17.7 | 15.1 | 8.8 | 4.8 | 3.7 | – | 2.0 | 2.1 | 47.9 | 50.1 |
| 24 Apr–19 May | Kantar TNS | 17.7 | 20.6 | 9.4 | 18.7 | 14.3 | 8.6 | 4.6 | 3.7 | – | 2.4 | 1.9 | 47.7 | 49.9 |
| 10 Apr–9 May | Taloustutkimus | 18.4 | 21.1 | 9.6 | 18.6 | 14.6 | 7.7 | 4.5 | 3.6 | – | 1.9 | 2.5 | 49.1 | 49.0 |
| 16 Jan–11 Feb | TNS Gallup | 19.8 | 18.4 | 9.1 | 21.6 | 11.1 | 9.1 | 4.8 | 3.5 | – | 2.6 | 1.8 | 47.3 | 50.1 |
| 19 Dec–11 Jan | TNS Gallup | 19.9 | 18.7 | 8.6 | 21.7 | 12.1 | 8.5 | 4.4 | 3.6 | – | 2.5 | 1.8 | 47.2 | 50.3 |
| 2016 | ||||||||||||||
| 14 Nov–08 Dec | TNS Gallup | 20.8 | 18.4 | 9.9 | 20.8 | 11.2 | 8.2 | 4.6 | 3.5 | – | 2.6 | 0 | 49.1 | 48.3 |
| 2–29 Nov | Taloustutkimus | 20.4 | 18.9 | 8.5 | 21.1 | 12.6 | 8.6 | 4.0 | 3.6 | – | 2.3 | 0.7 | 47.8 | 49.9 |
| 17 Oct–11 Nov | TNS Gallup | 20.9 | 18.6 | 10.1 | 20.4 | 11.6 | 7.9 | 4.6 | 3.5 | – | 2.4 | 0.5 | 49.6 | 48.0 |
| 5 Oct–1 Nov | Taloustutkimus | 19.6 | 18.8 | 8.5 | 21.2 | 13.6 | 8.7 | 4.0 | 3.4 | – | 2.2 | 1.6 | 47.1 | 50.9 |
| 19 Sep–14 Oct | TNS Gallup | 20.9 | 17.7 | 9.7 | 21.3 | 11.8 | 7.9 | 4.7 | 3.5 | – | 2.4 | 0.4 | 48.3 | 49.2 |
| 12 Sep–04 Oct | Taloustutkimus | 20.5 | 17.1 | 9.2 | 20.5 | 14.0 | 8.8 | 4.3 | 3.8 | – | 1.8 | 0 | 46.8 | 51.4 |
| 22 Aug–15 Sep | TNS Gallup | 20.9 | 17.9 | 9.6 | 20.2 | 12.6 | 8.6 | 4.6 | 3.3 | – | 2.3 | 0.7 | 48.4 | 49.3 |
| 15 Aug–06 Sep | Taloustutkimus | 20.7 | 17.7 | 8.4 | 20.0 | 13.6 | 9.3 | 4.7 | 3.6 | – | 2.0 | 0.7 | 46.8 | 51.2 |
| 18 Jul–18 Aug | TNS Gallup | 20.6 | 17.3 | 9.5 | 19.1 | 12.9 | 9.6 | 4.8 | 3.7 | – | 2.5 | 1.5 | 47.4 | 50.1 |
| 11 Jul–09 Aug | Taloustutkimus | 21.8 | 17.6 | 7.6 | 18.9 | 13.7 | 9.8 | 4.3 | 4.3 | – | 2.0 | 2.9 | 47.0 | 50.8 |
| 20 Jun–15 Jul | TNS Gallup | 21.1 | 17.8 | 9.5 | 18.7 | 13.3 | 9.0 | 4.9 | 3.4 | – | 2.3 | 2.4 | 48.4 | 49.3 |
| 08 Jun–05 Jul | Taloustutkimus | 21.1 | 18.6 | 8.6 | 18.2 | 14.1 | 9.2 | 4.3 | 3.6 | – | 2.3 | 2.5 | 48.3 | 49.4 |
| 16 May–16 Jun | TNS Gallup | 20.9 | 17.0 | 9.1 | 20.6 | 13.6 | 8.2 | 4.7 | 3.7 | – | 2.2 | 0.3 | 47.0 | 50.8 |
| 9 May–7 Jun | Taloustutkimus | 20.2 | 17.7 | 9.0 | 20.1 | 14.8 | 8.3 | 4.2 | 3.5 | – | 2.2 | 0.1 | 46.9 | 50.9 |
| 12–14 May | TNS Gallup | 20.7 | 17.7 | 9.3 | 22.0 | 11.4 | 9.0 | 4.3 | 3.4 | – | 2.2 | 1.3 | 47.7 | 50.1 |
| 4 Apr–3 May | Taloustutkimus | 20.4 | 17.0 | 8.5 | 21.5 | 13.5 | 8.5 | 4.5 | 3.6 | – | 2.5 | 1.1 | 45.9 | 51.6 |
| 14 Mar–11 Apr | TNS Gallup | 20.6 | 17.1 | 9.7 | 21.7 | 11.7 | 8.7 | 4.4 | 3.7 | – | 2.4 | 1.1 | 47.4 | 50.2 |
| 7–30 Mar | Taloustutkimus | 21.7 | 17.1 | 9.5 | 20.3 | 12.5 | 8.3 | 4.7 | 3.6 | – | 2.3 | 1.4 | 48.3 | 49.4 |
| 15 Feb–11 Mar | TNS Gallup | 21.5 | 17.4 | 10.2 | 21.4 | 10.9 | 8.3 | 4.5 | 3.5 | – | 2.3 | 0.1 | 49.1 | 48.6 |
| 3 Feb–1 Mar | Taloustutkimus | 20.7 | 16.9 | 9.0 | 22.9 | 10.7 | 8.9 | 4.5 | 3.9 | – | 2.5 | 2.2 | 46.6 | 50.9 |
| 18 Jan–14 Feb | TNS Gallup | 21.4 | 18.0 | 9.9 | 21.2 | 10.8 | 8.5 | 4.3 | 3.7 | – | 2.2 | 0.2 | 49.3 | 48.5 |
| 11 Jan–2 Feb | Taloustutkimus | 20.9 | 17.3 | 9.8 | 21.5 | 12.3 | 8.6 | 4.1 | 3.4 | – | 2.1 | 0.6 | 48.0 | 49.9 |
| 14 Dec–14 Jan | TNS Gallup | 19.7 | 17.9 | 9.6 | 22.8 | 11.1 | 7.9 | 4.5 | 4.2 | – | 2.3 | 3.1 | 47.2 | 50.5 |
| 2015 | ||||||||||||||
| 7–29 Dec | Taloustutkimus | 21.4 | 18.7 | 8.9 | 22.7 | 11.7 | 7.3 | 3.9 | 3.4 | – | 2.0 | 1.3 | 49.0 | 49.0 |
| 16 Nov–10 Dec | TNS Gallup | 20.9 | 17.7 | 10.8 | 21.1 | 11.3 | 8.4 | 4.3 | 3.5 | – | 2.0 | 0.2 | 49.4 | 48.6 |
| 9 Nov–1 Dec | Taloustutkimus | 21.6 | 18.3 | 8.9 | 21.0 | 12.6 | 8.1 | 4.6 | 3.5 | – | 1.4 | 0.6 | 48.8 | 49.8 |
| 19 Oct–12 Nov | TNS Gallup | 21.6 | 18.4 | 11.0 | 19.6 | 11.6 | 8.0 | 4.3 | 3.5 | – | 2.0 | 2.0 | 51.0 | 47.0 |
| 12 Oct–3 Nov | Taloustutkimus | 21.7 | 18.3 | 9.8 | 20.7 | 12.2 | 7.4 | 4.4 | 3.4 | – | 2.1 | 1.0 | 49.8 | 48.1 |
| 14 Sep–16 Oct | TNS Gallup | 22.2 | 17.7 | 11.4 | 18.3 | 11.5 | 8.6 | 4.4 | 3.9 | – | 2.0 | 3.9 | 51.3 | 46.7 |
| 7 Sep–6 Oct | Taloustutkimus | 21.7 | 18.0 | 10.7 | 18.3 | 12.7 | 8.3 | 4.8 | 4.0 | – | 1.5 | 3.7 | 50.4 | 48.1 |
| 10 Aug–10 Sep | TNS Gallup | 22.3 | 18.0 | 15.6 | 15.0 | 11.1 | 7.8 | 4.8 | 3.5 | – | 1.9 | 4.3 | 55.9 | 42.2 |
| 10 Aug–1 Sep | Taloustutkimus | 23.0 | 18.9 | 15.0 | 14.4 | 12.4 | 7.6 | 4.2 | 2.9 | – | 1.6 | 4.1 | 56.9 | 41.5 |
| 13 Jul–7 Aug | TNS Gallup | 23.2 | 17.6 | 16.7 | 14.2 | 11.4 | 7.2 | 4.7 | 3.1 | – | 1.9 | 5.6 | 57.5 | 40.6 |
| 7 Jul–4 Aug | Taloustutkimus | 23.1 | 18.2 | 15.6 | 14.5 | 12.7 | 7.8 | 3.9 | 2.7 | – | 1.5 | 4.9 | 56.9 | 41.6 |
| 15 Jun–9 Jul | TNS Gallup | 21.9 | 18.2 | 17.6 | 14.7 | 9.8 | 7.9 | 4.5 | 3.3 | – | 2.1 | 3.7 | 57.7 | 40.2 |
| 3 Jun–1 Jul | Taloustutkimus | 22.7 | 17.3 | 15.6 | 14.6 | 11.5 | 8.4 | 4.5 | 3.4 | – | 2.0 | 5.4 | 55.6 | 42.4 |
| 18 May–11 Jun | TNS Gallup | 21.0 | 18.5 | 18.0 | 14.8 | 10.0 | 7.8 | 4.5 | 3.2 | – | 2.2 | 2.5 | 57.5 | 40.4 |
| 4 May–2 Jun | Taloustutkimus | 23.1 | 16.7 | 17.5 | 15.0 | 10.5 | 7.5 | 4.5 | 3.1 | – | 2.1 | 5.6 | 57.3 | 40.6 |
| 20 Apr–15 May | TNS Gallup | 21.1 | 18.0 | 19.2 | 15.1 | 9.3 | 6.8 | 4.6 | 3.4 | – | 2.5 | 1.9 | 58.3 | 39.2 |
| 19 Apr 2015 | Election Results | 21.1 | 18.2 | 17.7 | 16.5 | 8.5 | 7.1 | 4.9 | 3.5 | – | 2.5 | 2.9 | 57.0 | 40.5 |
Opinion polls showing seat projections are displayed in the table below. The highest seat figures in each polling survey have their background shaded in the leading party's colour. In the instance that there is a tie, then no figure is shaded. 101 seats are required for an absolute majority in the Finnish Parliament.
| Date | Polling Firm | KESK | PS | KOK | SDP | VIHR | VAS | SFP | KD | SIN | Others |
|---|---|---|---|---|---|---|---|---|---|---|---|
| 9 Apr 2019 | Taloustutkimus [note 1] | 33 | 29 | 36 | 45 | 26 | 16 | 7 | 5 | – | 2 |
| 26 Mar 2019 | Taloustutkimus [note 2] | 35 | 22 | 40 | 47 | 27 | 16 | 7 | 4 | – | 1 |
| 5 Mar 2019 | Taloustutkimus [note 3] | 36 | 21 | 41 | 49 | 26 | 15 | 7 | 4 | – | – |
| 5 Feb 2019 | Taloustutkimus [note 4] | 38 | 20 | 39 | 49 | 26 | 16 | 7 | 3 | – | 1 |
| 10 Jan 2019 | Taloustutkimus [note 5] | 42 | 15 | 43 | 47 | 25 | 15 | 7 | 5 | – | – |
| 2015 Election | - | 49 | 38 | 37 | 34 | 15 | 12 | 9 | 5 | 0 | 1 |
Some opinion pollsters have asked voters which party leader they would prefer as Prime Minister.
| Date | Polling Firm | Juha Sipilä | Petteri Orpo | Jussi Halla-aho | Timo Soini | Antti Rinne | Pekka Haavisto | Touko Aalto | Ville Niinistö | Li Andersson | Anna-Maja Henriksson | Sari Essayah | Paavo Väyrynen | Sampo Terho |
|---|---|---|---|---|---|---|---|---|---|---|---|---|---|---|
| 25 Mar–2 Apr 2019 | Taloustutkimus | 10 | 12 | 8 | – | 14 | 21 | – | – | 7 | 2 | 3 | – | 1 |
| 27 Mar 2019 | Kantar TNS | 14 | 16 | 9 | – | 15 | 22 | – | – | 5 | – | – | – | – |
| 17 Feb 2019 | Kantar TNS | 10 | 15 | 9 | – | 12 | 18 | – | – | 8 | – | – | – | 1 |
| 5 Jan 2019 | Taloustutkimus | 13 | 16 | 5 | – | 12 | 22 | – | – | 5 | 1 | 4 | – | 1 |
| 12-17 Jan 2018 | Kantar TNS | 12 | 17 | 9 | – | 8 | – | 3 | – | 13 | – | – | – | 2 |
| 7 Nov 2017 | Taloustutkimus | 15 | 25 | 7 | – | 8 | – | 8 | – | 12 | – | – | – | – |
| 28–29 Jun 2017 | Taloustutkimus | 21 | 19 | 13 | – | 11 | – | 4 | – | 6 | 1 | 3 | – | – |
| 19–28 Jun 2017 | Taloustutkimus | 26.4 | 30.6 | 8.3 | – | 15.3 | – | 8.3 | – | – | – | – | 6.9 | – |
| 19–31 Dec 2016 | Taloustutkimus | 25.4 | 19.7 | – | 7.0 | 15.5 | – | – | 22.5 | – | 2.8 | – | 7.0 | – |