
Ozone is an inorganic molecule with the chemical formula O
3. It is a pale blue gas with a distinctively pungent smell. It is an allotrope of oxygen that is much less stable than the diatomic allotrope O
2, breaking down in the lower atmosphere to O
2 (dioxygen). Ozone is formed from dioxygen by the action of ultraviolet (UV) light and electrical discharges within the Earth's atmosphere. It is present in very low concentrations throughout the atmosphere, with its highest concentration high in the ozone layer of the stratosphere, which absorbs most of the Sun's ultraviolet (UV) radiation.

Ground-level ozone (O3), also known as surface-level ozone and tropospheric ozone, is a trace gas in the troposphere (the lowest level of the Earth's atmosphere), with an average concentration of 20–30 parts per billion by volume (ppbv), with close to 100 ppbv in polluted areas. Ozone is also an important constituent of the stratosphere, where the ozone layer (2 to 8 parts per million ozone) exists which is located between 10 and 50 kilometers above the Earth's surface. The troposphere extends from the ground up to a variable height of approximately 14 kilometers above sea level. Ozone is least concentrated in the ground layer (or planetary boundary layer) of the troposphere. Ground-level or tropospheric ozone is created by chemical reactions between NOx gases (oxides of nitrogen produced by combustion) and volatile organic compounds (VOCs). The combination of these chemicals in the presence of sunlight form ozone. Its concentration increases as height above sea level increases, with a maximum concentration at the tropopause. About 90% of total ozone in the atmosphere is in the stratosphere, and 10% is in the troposphere. Although tropospheric ozone is less concentrated than stratospheric ozone, it is of concern because of its health effects. Ozone in the troposphere is considered a greenhouse gas, and may contribute to global warming.

Indoor air quality (IAQ) is the air quality within buildings and structures. Poor indoor air quality due to indoor air pollution is known to affect the health, comfort, and well-being of building occupants. It has also been linked to sick building syndrome, respiratory issues, reduced productivity, and impaired learning in schools. Common pollutants of indoor air include: secondhand tobacco smoke, air pollutants from indoor combustion, radon, molds and other allergens, carbon monoxide, volatile organic compounds, legionella and other bacteria, asbestos fibers, carbon dioxide, ozone and particulates. Source control, filtration, and the use of ventilation to dilute contaminants are the primary methods for improving indoor air quality.

The U.S. National Ambient Air Quality Standards are limits on atmospheric concentration of six pollutants that cause smog, acid rain, and other health hazards. Established by the United States Environmental Protection Agency (EPA) under authority of the Clean Air Act, NAAQS is applied for outdoor air throughout the country.

An air quality index (AQI) is an indicator developed by government agencies to communicate to the public how polluted the air currently is or how polluted it is forecast to become. As air pollution levels rise, so does the AQI, along with the associated public health risk. Children, the elderly and individuals with respiratory or cardiovascular problems are typically the first groups affected by poor air quality. When the AQI is high, governmental bodies generally encourage people to reduce physical activity outdoors, or even avoid going out altogether. When wildfires result in a high AQI, the use of a mask outdoors and an air purifier indoors are also encouraged.

The Air Pollution Index is a simple and generalized way to describe the air quality, which is used in Malaysia. It is calculated from several sets of air pollution data and was formerly used in mainland China and Hong Kong. In mainland China the API was replaced by an updated air quality index in early 2012 and on 30 December 2013 Hong Kong moved to a health based index.

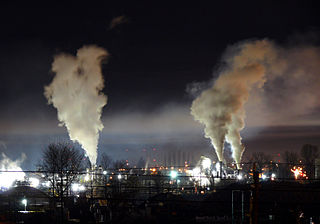
Air pollution is the contamination of air due to the presence of substances called pollutants in the atmosphere that are harmful to the health of humans and other living beings, or cause damage to the climate or to materials. It is also the contamination of the indoor or outdoor environment either by chemical, physical, or biological agents that alters the natural features of the atmosphere. There are many different types of air pollutants, such as gases, particulates, and biological molecules. Air pollution can cause diseases, allergies, and even death to humans; it can also cause harm to other living organisms such as animals and crops, and may damage the natural environment or built environment. Air pollution can be caused by both human activities and natural phenomena.
The Environmental Benefits Mapping and Analysis Program (BenMAP) is an open source, Windows-based computer program created by the U.S. Environmental Protection Agency that estimates the health benefits from improvements in air quality. State, local and international users have used BenMAP to estimate the health benefits of improved air quality. BenMAP includes information users need to start performing a benefits analysis; advanced users can customize the program to meet their needs. Because BenMAP is based on a GIS, the results can be mapped for ease of presentation.

Air Pollution in Mexico City has been of concern to the city's population and health officials for decades. In the 20th century, Mexico City's population rapidly increased as industrialization brought thousands of migrants from all over the world. Such a rapid and unexpected growth led to the UN declaring Mexico City as the most polluted city in the world in 1992. This was partly due to Mexico City's high altitude, which causes its oxygen levels to be 25% lower. Carbon-based fuels also do not combust completely. Other factors include the proliferation of vehicles, rapid industrial growth, and the population boom. The Mexican government has several active plans to reduce emission levels which require citizen participation, vehicular restrictions, increase of green areas, and expanded bicycle accessibility.
Air pollution is the release of pollutants into the air that are detrimental to human health and the Earth. In Canada, air pollution is regulated by standards set by the Canadian Council of Ministers of the Environment (CCME), an inter-governmental body of federal, provincial and territorial Ministers responsible for the environment. Air pollution from the United States and to lesser extent Canada; caused by metal smelting, coal-burning for utilities, and vehicle emissions has resulted in acid rain, has severely impacted Canadian waterways, forest growth, and agricultural productivity.

Particulates or atmospheric particulate matter are microscopic particles of solid or liquid matter suspended in the air. The term aerosol commonly refers to the particulate/air mixture, as opposed to the particulate matter alone. Sources of particulate matter can be natural or anthropogenic. They have impacts on climate and precipitation that adversely affect human health, in ways additional to direct inhalation.
The Air Quality Health Index (AQHI) is a scale designed in Canada to help understand the impact of air quality on health. It is a health protection tool used to make decisions to reduce short-term exposure to air pollution by adjusting activity levels during increased levels of air pollution. The Air Quality Health Index also provides advice on how to improve air quality by proposing behavioral change to reduce the environmental footprint. This index pays particular attention to people who are sensitive to air pollution. It provides them with advice on how to protect their health during air quality levels associated with low, moderate, high and very high health risks.
The PM NowCast is a weighted average of hourly air monitoring data used by the United States Environmental Protection Agency (USEPA) for real-time reporting of the Air Quality Index (AQI) for PM (PM10 or PM2.5).
Ambient air quality criteria, or standards, are concentrations of pollutants in the air, and typically refer to outdoor air. The criteria are specified for a variety of reasons including for the protection of human health, buildings, crops, vegetation, ecosystems, as well as for planning and other purposes. There is no internationally accepted definition but usually "standards" have some legal or enforcement aspect, whereas "guidelines" may not be backed by laws. "Criteria/criterion" can be used as a generic term to cover standards and guidelines.

The air quality in Delhi, the capital territory of India, according to a WHO survey of 1,650 world cities, and a survey of 7,000 world cities by the US-based Health Effects Institute in August 2022, is the worst of any major city in the world. It also affects the districts around Delhi. Air pollution in India is estimated to kill about 2 million people every year; it is the fifth largest killer in India. India has the world's highest death rate from chronic respiratory diseases and asthma, according to the WHO. In Delhi, poor quality air irreversibly damages the lungs of 2.2 million or 50 percent of all children.

Nitrogen dioxide poisoning is the illness resulting from the toxic effect of nitrogen dioxide. It usually occurs after the inhalation of the gas beyond the threshold limit value. Nitrogen dioxide is reddish-brown with a very harsh smell at high concentrations, at lower concentrations it is colorless but may still have a harsh odour. Nitrogen dioxide poisoning depends on the duration, frequency, and intensity of exposure.

The World Health Organization guidelines were most recently updated in 2021. The guidelines offer guidance about these air pollutants: particulate matter (PM), ozone (O3), nitrogen dioxide (NO2), sulfur dioxide (SO2) and carbon monoxide (CO). The WHO first released the air quality guidelines in 1987, then updated them in 1997. The reports provide guidelines intending to give guidelines to reduce the health effects of air pollution.
Since the late 1970s, the European Union's (EU) policy has been to develop and drive appropriate measures to improve air quality throughout the EU. The control of emissions from mobile sources, improving fuel quality and promoting and integrating environmental protection requirements into the transport and energy sector are part of these aims.
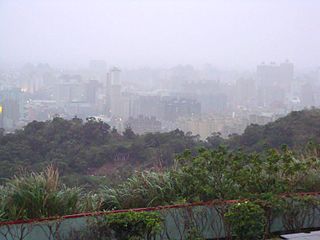
Air pollution in Taiwan is mostly derived from sources of domestic combustion, primarily the burning of fossil fuels. Taiwan's topography has been noted to be a contributing factor to its air pollution problem, leading to poor dispersal and trapping pollutants. Taipei, Taiwan's capital and largest city for example, is surrounded by mountains, and other industrial centers along the northern and western coasts of Taiwan are surrounded by high mountains.
Directive 2008/50/EC, or the Ambient Air Quality Directive, is an EU directive which limits sulphur dioxide, NO2 and other oxides of nitrogen, particulate matter (PM10, PM2.5), lead, benzene and carbon monoxide concentrations from 2010. Hourly average concentrations of NO2 are limited to 200 μg/m3 and yearly average concentrations to 40 μg/m3. As of 2018 several EU member states are being sued for violating the limits: France, Spain, Italy, Hungary, Romania, Slovakia, the Czech Republic, the United Kingdom and Germany.
