Related Research Articles
Biostatistics are the development and application of statistical methods to a wide range of topics in biology. It encompasses the design of biological experiments, the collection and analysis of data from those experiments and the interpretation of the results.
In statistics, the power of a binary hypothesis test is the probability that the test correctly rejects the null hypothesis when a specific alternative hypothesis is true. It is commonly denoted by , and represents the chances of a true positive detection conditional on the actual existence of an effect to detect. Statistical power ranges from 0 to 1, and as the power of a test increases, the probability of making a type II error by wrongly failing to reject the null hypothesis decreases.

The base rate fallacy, also called base rate neglect or base rate bias, is a type of fallacy in which people tend to ignore the base rate in favor of the individuating information . Base rate neglect is a specific form of the more general extension neglect.
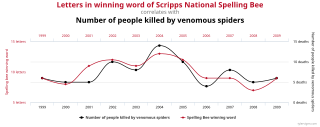
Data dredging is the misuse of data analysis to find patterns in data that can be presented as statistically significant, thus dramatically increasing and understating the risk of false positives. This is done by performing many statistical tests on the data and only reporting those that come back with significant results.
In statistics, Duncan's new multiple range test (MRT) is a multiple comparison procedure developed by David B. Duncan in 1955. Duncan's MRT belongs to the general class of multiple comparison procedures that use the studentized range statistic qr to compare sets of means.
In statistics, the false discovery rate (FDR) is a method of conceptualizing the rate of type I errors in null hypothesis testing when conducting multiple comparisons. FDR-controlling procedures are designed to control the FDR, which is the expected proportion of "discoveries" that are false. Equivalently, the FDR is the expected ratio of the number of false positive classifications to the total number of positive classifications. The total number of rejections of the null include both the number of false positives (FP) and true positives (TP). Simply put, FDR = FP /. FDR-controlling procedures provide less stringent control of Type I errors compared to family-wise error rate (FWER) controlling procedures, which control the probability of at least one Type I error. Thus, FDR-controlling procedures have greater power, at the cost of increased numbers of Type I errors.
In statistics, family-wise error rate (FWER) is the probability of making one or more false discoveries, or type I errors when performing multiple hypotheses tests.
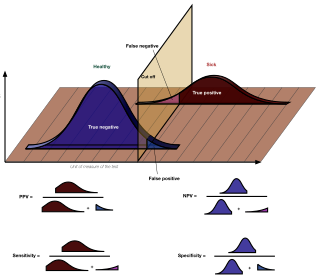
Sensitivity and specificity mathematically describe the accuracy of a test which reports the presence or absence of a condition. Individuals for which the condition is satisfied are considered "positive" and those for which it is not are considered "negative".
In statistical hypothesis testing, a type I error is the mistaken rejection of an actually true null hypothesis, while a type II error is the failure to reject a null hypothesis that is actually false. Much of statistical theory revolves around the minimization of one or both of these errors, though the complete elimination of either is a statistical impossibility if the outcome is not determined by a known, observable causal process. By selecting a low threshold (cut-off) value and modifying the alpha (α) level, the quality of the hypothesis test can be increased. The knowledge of type I errors and type II errors is widely used in medical science, biometrics and computer science.
In statistics, the Bonferroni correction is a method to counteract the multiple comparisons problem. Bonferroni correction is the simplest method for counteracting this; however, it is a conservative method that gives greater risk of failure to reject a false null hypothesis than other methods, as it ignores potentially valuable information, such as the distribution of p-values across all comparisons.
In statistics, the multiple comparisons, multiplicity or multiple testing problem occurs when one considers a set of statistical inferences simultaneously or infers a subset of parameters selected based on the observed values.

The Single Nucleotide Polymorphism Database (dbSNP) is a free public archive for genetic variation within and across different species developed and hosted by the National Center for Biotechnology Information (NCBI) in collaboration with the National Human Genome Research Institute (NHGRI). Although the name of the database implies a collection of one class of polymorphisms only, it in fact contains a range of molecular variation: (1) SNPs, (2) short deletion and insertion polymorphisms (indels/DIPs), (3) microsatellite markers or short tandem repeats (STRs), (4) multinucleotide polymorphisms (MNPs), (5) heterozygous sequences, and (6) named variants. The dbSNP accepts apparently neutral polymorphisms, polymorphisms corresponding to known phenotypes, and regions of no variation. It was created in September 1998 to supplement GenBank, NCBI’s collection of publicly available nucleic acid and protein sequences.
In statistics, when performing multiple comparisons, a false positive ratio is the probability of falsely rejecting the null hypothesis for a particular test. The false positive rate is calculated as the ratio between the number of negative events wrongly categorized as positive and the total number of actual negative events.
The Newman–Keuls or Student–Newman–Keuls (SNK)method is a stepwise multiple comparisons procedure used to identify sample means that are significantly different from each other. It was named after Student (1927), D. Newman, and M. Keuls. This procedure is often used as a post-hoc test whenever a significant difference between three or more sample means has been revealed by an analysis of variance (ANOVA). The Newman–Keuls method is similar to Tukey's range test as both procedures use studentized range statistics. Unlike Tukey's range test, the Newman–Keuls method uses different critical values for different pairs of mean comparisons. Thus, the procedure is more likely to reveal significant differences between group means and to commit type I errors by incorrectly rejecting a null hypothesis when it is true. In other words, the Neuman-Keuls procedure is more powerful but less conservative than Tukey's range test.

Yoav Benjamini is an Israeli statistician best known for development of the “false discovery rate” criterion. He is currently The Nathan and Lily Silver Professor of Applied Statistics at Tel Aviv University.
In statistics, a false coverage rate (FCR) is the average rate of false coverage, i.e. not covering the true parameters, among the selected intervals.
A false positive is an error in binary classification in which a test result incorrectly indicates the presence of a condition, while a false negative is the opposite error, where the test result incorrectly indicates the absence of a condition when it is actually present. These are the two kinds of errors in a binary test, in contrast to the two kinds of correct result. They are also known in medicine as a false positivediagnosis, and in statistical classification as a false positiveerror.
Misuse of p-values is common in scientific research and scientific education. p-values are often used or interpreted incorrectly; the American Statistical Association states that p-values can indicate how incompatible the data are with a specified statistical model. From a Neyman–Pearson hypothesis testing approach to statistical inferences, the data obtained by comparing the p-value to a significance level will yield one of two results: either the null hypothesis is rejected, or the null hypothesis cannot be rejected at that significance level. From a Fisherian statistical testing approach to statistical inferences, a low p-value means either that the null hypothesis is true and a highly improbable event has occurred or that the null hypothesis is false.
In statistical hypothesis testing, specifically multiple hypothesis testing, the q-value provides a means to control the positive false discovery rate (pFDR). Just as the p-value gives the expected false positive rate obtained by rejecting the null hypothesis for any result with an equal or smaller p-value, the q-value gives the expected pFDR obtained by rejecting the null hypothesis for any result with an equal or smaller q-value.
References
- ↑ Benjamini, Yoav; Hochberg, Yosef (1995). "Controlling the false discovery rate: a practical and powerful approach to multiple testing" (PDF). Journal of the Royal Statistical Society, Series B . 57 (1): 289–300. MR 1325392.
| | This statistics-related article is a stub. You can help Wikipedia by expanding it. |