Related Research Articles
In statistics, an estimator is a rule for calculating an estimate of a given quantity based on observed data: thus the rule, the quantity of interest and its result are distinguished. For example, the sample mean is a commonly used estimator of the population mean.

The Mandelbrot set is a two-dimensional set with a relatively simple definition that exhibits great complexity, especially as it is magnified. It is popular for its aesthetic appeal and fractal structures. The set is defined in the complex plane as the complex numbers for which the function does not diverge to infinity when iterated starting at , i.e., for which the sequence , , etc., remains bounded in absolute value.
In integrated circuit manufacturing, photolithography or optical lithography is a general term used for techniques that use light to produce minutely patterned thin films of suitable materials over a substrate, such as a silicon wafer, to protect selected areas of it during subsequent etching, deposition, or implantation operations. Typically, ultraviolet light is used to transfer a geometric design from an optical mask to a light-sensitive chemical (photoresist) coated on the substrate. The photoresist either breaks down or hardens where it is exposed to light. The patterned film is then created by removing the softer parts of the coating with appropriate solvents, also known in this case as developers.

In astronomy, a light curve is a graph of the light intensity of a celestial object or region as a function of time, typically with the magnitude of light received on the y-axis and with time on the x-axis. The light is usually in a particular frequency interval or band.

In dynamical systems theory and control theory, a phase space or state space is a space in which all possible "states" of a dynamical system or a control system are represented, with each possible state corresponding to one unique point in the phase space. For mechanical systems, the phase space usually consists of all possible values of position and momentum variables. It is the direct product of direct space and reciprocal space. The concept of phase space was developed in the late 19th century by Ludwig Boltzmann, Henri Poincaré, and Josiah Willard Gibbs.
The field of strength of materials typically refers to various methods of calculating the stresses and strains in structural members, such as beams, columns, and shafts. The methods employed to predict the response of a structure under loading and its susceptibility to various failure modes takes into account the properties of the materials such as its yield strength, ultimate strength, Young's modulus, and Poisson's ratio. In addition, the mechanical element's macroscopic properties such as its length, width, thickness, boundary constraints and abrupt changes in geometry such as holes are considered.

DirectShow, codename Quartz, is a multimedia framework and API produced by Microsoft for software developers to perform various operations with media files or streams. It is the replacement for Microsoft's earlier Video for Windows technology. Based on the Microsoft Windows Component Object Model (COM) framework, DirectShow provides a common interface for media across various programming languages, and is an extensible, filter-based framework that can render or record media files on demand at the request of the user or developer. The DirectShow development tools and documentation were originally distributed as part of the DirectX SDK. Currently, they are distributed as part of the Windows SDK.
In computer architecture, speedup is a number that measures the relative performance of two systems processing the same problem. More technically, it is the improvement in speed of execution of a task executed on two similar architectures with different resources. The notion of speedup was established by Amdahl's law, which was particularly focused on parallel processing. However, speedup can be used more generally to show the effect on performance after any resource enhancement.

In science and engineering, a log–log graph or log–log plot is a two-dimensional graph of numerical data that uses logarithmic scales on both the horizontal and vertical axes. Power functions – relationships of the form – appear as straight lines in a log–log graph, with the exponent corresponding to the slope, and the coefficient corresponding to the intercept. Thus these graphs are very useful for recognizing these relationships and estimating parameters. Any base can be used for the logarithm, though most commonly base 10 are used.
The parameter space is the space of possible parameter values that define a particular mathematical model, often a subset of finite-dimensional Euclidean space. Often the parameters are inputs of a function, in which case the technical term for the parameter space is domain of a function. The ranges of values of the parameters may form the axes of a plot, and particular outcomes of the model may be plotted against these axes to illustrate how different regions of the parameter space produce different types of behavior in the model.
Query optimization is a feature of many relational database management systems and other databases such as NoSQL and graph databases. The query optimizer attempts to determine the most efficient way to execute a given query by considering the possible query plans.
In statistics and image processing, to smooth a data set is to create an approximating function that attempts to capture important patterns in the data, while leaving out noise or other fine-scale structures/rapid phenomena. In smoothing, the data points of a signal are modified so individual points higher than the adjacent points are reduced, and points that are lower than the adjacent points are increased leading to a smoother signal. Smoothing may be used in two important ways that can aid in data analysis (1) by being able to extract more information from the data as long as the assumption of smoothing is reasonable and (2) by being able to provide analyses that are both flexible and robust. Many different algorithms are used in smoothing.
Origin is a proprietary computer program for interactive scientific graphing and data analysis. It is produced by OriginLab Corporation, and runs on Microsoft Windows. It has inspired several platform-independent open-source clones and alternatives like LabPlot and SciDAVis.
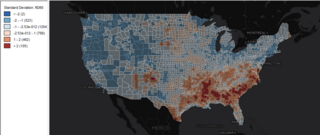
GeoDa is a free software package that conducts spatial data analysis, geovisualization, spatial autocorrelation and spatial modeling.

Performance Monitor is a system monitoring program introduced in Windows NT 3.1. It monitors various activities on a computer such as CPU or memory usage. This type of application may be used to determine the cause of problems on a local or remote computer by measuring the performance of hardware, software services, and applications. The program can define thresholds for alerts and automatic actions, generate reports, and view past performance data.
Neuron is a simulation environment for modeling individual and networks of neurons. It was primarily developed by Michael Hines, John W. Moore, and Ted Carnevale at Yale and Duke.
In mathematical dynamics, discrete time and continuous time are two alternative frameworks within which variables that evolve over time are modeled.

KAlgebra is a mathematical graph calculator included in the KDE education package. While it is based on the MathML content markup language, knowledge of MathML is not required for use. The calculator includes numerical, logical, symbolic, and analytical functions, and can plot the results onto a 2D or 3D graph. KAlgebra is free and open source software, licensed under the GPL-2.0-or-later license.

MLAB is a multi-paradigm numerical computing environment and fourth-generation programming language was originally developed at the National Institutes of Health.
Weak supervision, also called semi-supervised learning, is a paradigm in machine learning, the relevance and notability of which increased with the advent of large language models due to large amount of data required to train them. It is characterized by using a combination of a small amount of human-labeled data, followed by a large amount of unlabeled data. In other words, the desired output values are provided only for a subset of the training data. The remaining data is unlabeled or imprecisely labeled. Intuitively, it can be seen as an exam and labeled data as sample problems that the teacher solves for the class as an aid in solving another set of problems. In the transductive setting, these unsolved problems act as exam questions. In the inductive setting, they become practice problems of the sort that will make up the exam. Technically, it could be viewed as performing clustering and then labeling the clusters with the labeled data, pushing the decision boundary away from high-density regions, or learning an underlying one-dimensional manifold where the data reside.
References
- ↑ Mack, Chris. "Swing curves and the process window" (PDF). Tutorials on Photolithography. Retrieved 1 October 2013.