
In descriptive statistics, the interquartile range (IQR) is a measure of statistical dispersion, which is the spread of the data. The IQR may also be called the midspread, middle 50%, fourth spread, or H‑spread. It is defined as the difference between the 75th and 25th percentiles of the data. To calculate the IQR, the data set is divided into quartiles, or four rank-ordered even parts via linear interpolation. These quartiles are denoted by Q1 (also called the lower quartile), Q2 (the median), and Q3 (also called the upper quartile). The lower quartile corresponds with the 25th percentile and the upper quartile corresponds with the 75th percentile, so IQR = Q3 − Q1.
In statistics, quartiles are a type of quantiles which divide the number of data points into four parts, or quarters, of more-or-less equal size. The data must be ordered from smallest to largest to compute quartiles; as such, quartiles are a form of order statistic. The three quartiles, resulting in four data divisions, are as follows:

In probability theory and statistics, the chi-squared distribution with degrees of freedom is the distribution of a sum of the squares of independent standard normal random variables. The chi-squared distribution is a special case of the gamma distribution and is one of the most widely used probability distributions in inferential statistics, notably in hypothesis testing and in construction of confidence intervals. This distribution is sometimes called the central chi-squared distribution, a special case of the more general noncentral chi-squared distribution.

In statistics, an outlier is a data point that differs significantly from other observations. An outlier may be due to a variability in the measurement, an indication of novel data, or it may be the result of experimental error; the latter are sometimes excluded from the data set. An outlier can be an indication of exciting possibility, but can also cause serious problems in statistical analyses.
Student's t-test is a statistical test used to test whether the difference between the response of two groups is statistically significant or not. It is any statistical hypothesis test in which the test statistic follows a Student's t-distribution under the null hypothesis. It is most commonly applied when the test statistic would follow a normal distribution if the value of a scaling term in the test statistic were known. When the scaling term is estimated based on the data, the test statistic—under certain conditions—follows a Student's t distribution. The t-test's most common application is to test whether the means of two populations are significantly different. In many cases, a Z-test will yield very similar results to a t-test since the latter converges to the former as the size of the dataset increases.
In statistics, the Wald test assesses constraints on statistical parameters based on the weighted distance between the unrestricted estimate and its hypothesized value under the null hypothesis, where the weight is the precision of the estimate. Intuitively, the larger this weighted distance, the less likely it is that the constraint is true. While the finite sample distributions of Wald tests are generally unknown, it has an asymptotic χ2-distribution under the null hypothesis, a fact that can be used to determine statistical significance.
This glossary of statistics and probability is a list of definitions of terms and concepts used in the mathematical sciences of statistics and probability, their sub-disciplines, and related fields. For additional related terms, see Glossary of mathematics and Glossary of experimental design.
A portmanteau test is a type of statistical hypothesis test in which the null hypothesis is well specified, but the alternative hypothesis is more loosely specified. Tests constructed in this context can have the property of being at least moderately powerful against a wide range of departures from the null hypothesis. Thus, in applied statistics, a portmanteau test provides a reasonable way of proceeding as a general check of a model's match to a dataset where there are many different ways in which the model may depart from the underlying data generating process. Use of such tests avoids having to be very specific about the particular type of departure being tested.
In statistics, Duncan's new multiple range test (MRT) is a multiple comparison procedure developed by David B. Duncan in 1955. Duncan's MRT belongs to the general class of multiple comparison procedures that use the studentized range statistic qr to compare sets of means.

In statistics, a Q–Q plot (quantile–quantile plot) is a probability plot, a graphical method for comparing two probability distributions by plotting their quantiles against each other. A point (x, y) on the plot corresponds to one of the quantiles of the second distribution (y-coordinate) plotted against the same quantile of the first distribution (x-coordinate). This defines a parametric curve where the parameter is the index of the quantile interval.
The Ljung–Box test is a type of statistical test of whether any of a group of autocorrelations of a time series are different from zero. Instead of testing randomness at each distinct lag, it tests the "overall" randomness based on a number of lags, and is therefore a portmanteau test.

In statistics, the monotone likelihood ratio property is a property of the ratio of two probability density functions (PDFs). Formally, distributions and bear the property if

In probability and statistics, the quantile function outputs the value of a random variable such that its probability is less than or equal to an input probability value. Intuitively, the quantile function associates with a range at and below a probability input the likelihood that a random variable is realized in that range for some probability distribution. It is also called the percentile function, percent-point function, inverse cumulative distribution function or inverse distribution function.
In statistics, the studentized range, denoted q, is the difference between the largest and smallest data in a sample normalized by the sample standard deviation. It is named after William Sealy Gosset, and was introduced by him in 1927. The concept was later discussed by Newman (1939), Keuls (1952), and John Tukey in some unpublished notes. Its statistical distribution is the studentized range distribution, which is used for multiple comparison procedures, such as the single step procedure Tukey's range test, the Newman–Keuls method, and the Duncan's step down procedure, and establishing confidence intervals that are still valid after data snooping has occurred.
Tukey's range test, also known as Tukey's test, Tukey method, Tukey's honest significance test, or Tukey's HSDtest, is a single-step multiple comparison procedure and statistical test. It can be used to correctly interpret the statistical significance of the difference between means that have been selected for comparison because of their extreme values.

A plot is a graphical technique for representing a data set, usually as a graph showing the relationship between two or more variables. The plot can be drawn by hand or by a computer. In the past, sometimes mechanical or electronic plotters were used. Graphs are a visual representation of the relationship between variables, which are very useful for humans who can then quickly derive an understanding which may not have come from lists of values. Given a scale or ruler, graphs can also be used to read off the value of an unknown variable plotted as a function of a known one, but this can also be done with data presented in tabular form. Graphs of functions are used in mathematics, sciences, engineering, technology, finance, and other areas.
The Newman–Keuls or Student–Newman–Keuls (SNK)method is a stepwise multiple comparisons procedure used to identify sample means that are significantly different from each other. It was named after Student (1927), D. Newman, and M. Keuls. This procedure is often used as a post-hoc test whenever a significant difference between three or more sample means has been revealed by an analysis of variance (ANOVA). The Newman–Keuls method is similar to Tukey's range test as both procedures use studentized range statistics. Unlike Tukey's range test, the Newman–Keuls method uses different critical values for different pairs of mean comparisons. Thus, the procedure is more likely to reveal significant differences between group means and to commit type I errors by incorrectly rejecting a null hypothesis when it is true. In other words, the Neuman-Keuls procedure is more powerful but less conservative than Tukey's range test.
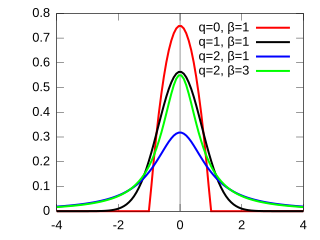
The q-Gaussian is a probability distribution arising from the maximization of the Tsallis entropy under appropriate constraints. It is one example of a Tsallis distribution. The q-Gaussian is a generalization of the Gaussian in the same way that Tsallis entropy is a generalization of standard Boltzmann–Gibbs entropy or Shannon entropy. The normal distribution is recovered as q → 1.
In mathematics and statistics, Q-distribution or q-distribution may refer to: