Related Research Articles
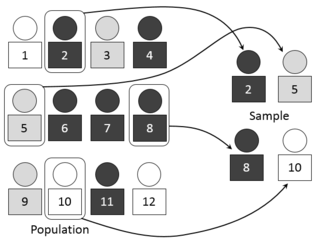
In statistics, quality assurance, and survey methodology, sampling is the selection of a subset or a statistical sample of individuals from within a statistical population to estimate characteristics of the whole population. Statisticians attempt to collect samples that are representative of the population. Sampling has lower costs and faster data collection compared to recording data from the entire population, and thus, it can provide insights in cases where it is infeasible to measure an entire population.

Preference regression is a statistical technique used by marketers to determine consumers’ preferred core benefits. It usually supplements product positioning techniques like multi dimensional scaling or factor analysis and is used to create ideal vectors on perceptual maps.
Statistics New Zealand, branded as Stats NZ, is the public service department of New Zealand charged with the collection of statistics related to the economy, population and society of New Zealand. To this end, Stats NZ produces censuses and surveys.
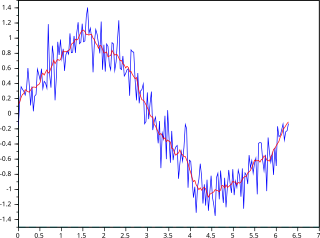
In statistics, a moving average is a calculation to analyze data points by creating a series of averages of different selections of the full data set. Variations include: simple, cumulative, or weighted forms.
Rake may refer to:
In epidemiology and demography, age adjustment, also called age standardization, is a technique used to allow statistical populations to be compared when the age profiles of the populations are quite different.

A sound level meter is used for acoustic measurements. It is commonly a hand-held instrument with a microphone. The best type of microphone for sound level meters is the condenser microphone, which combines precision with stability and reliability. The diaphragm of the microphone responds to changes in air pressure caused by sound waves. That is why the instrument is sometimes referred to as a sound pressure level meter (SPL). This movement of the diaphragm, i.e. the sound pressure, is converted into an electrical signal. While describing sound in terms of sound pressure, a logarithmic conversion is usually applied and the sound pressure level is stated instead, in decibels (dB), with 0 dB SPL equal to 20 micropascals.

Disability-adjusted life years (DALYs) are a measure of overall disease burden, expressed as the number of years lost due to ill-health, disability, or early death. It was developed in the 1990s as a way of comparing the overall health and life expectancy of different countries.
In numerical analysis, multivariate interpolation is interpolation on functions of more than one variable ; when the variates are spatial coordinates, it is also known as spatial interpolation.
Generalized Procrustes analysis (GPA) is a method of statistical analysis that can be used to compare the shapes of objects, or the results of surveys, interviews, or panels. It was developed for analysing the results of free-choice profiling, a survey technique which allows respondents to describe a range of products in their own words or language. GPA is one way to make sense of free-choice profiling data; other ways can be multiple factor analysis (MFA), or the STATIS method. The method was first published by J. C. Gower in 1975.

An Education index is a component of the Human Development Index published every year by the United Nations Development Programme. Alongside the Economical indicators and Life Expectancy Index, it helps measure the educational attainment. GNI (PPP) per capita and life expectancy are also used with the education index to get the HDI of each country.
Barnes interpolation, named after Stanley L. Barnes, is the interpolation of unevenly spread data points from a set of measurements of an unknown function in two dimensions into an analytic function of two variables. An example of a situation where the Barnes scheme is important is in weather forecasting where measurements are made wherever monitoring stations may be located, the positions of which are constrained by topography. Such interpolation is essential in data visualisation, e.g. in the construction of contour plots or other representations of analytic surfaces.

In finance, a stock index, or stock market index, is an index that measures the performance of a stock market, or of a subset of a stock market. It helps investors compare current stock price levels with past prices to calculate market performance.

In the run up to the general election on 7 May 2015, various organisations carried out opinion polling to gauge voting intention. Results of such polls are displayed in this article. Most of the polling companies listed are members of the British Polling Council (BPC) and abide by its disclosure rules.

Multidimensional Poverty Indices use a range of indicators to calculate a summary poverty figure for a given population, in which a larger figure indicates a higher level of poverty. This figure considers both the proportion of the population that is deemed poor, and the 'breadth' of poverty experienced by these 'poor' households, following the Alkire & Foster 'counting method'. The method was developed following increased criticism of monetary and consumption based poverty measures, seeking to capture the deprivations in non-monetary factors that contribute towards well-being. While there is a standard set of indicators, dimensions, cutoffs and thresholds used for a 'Global MPI', the method is flexible and there are many examples of poverty studies that modify it to best suit their environment. The methodology has been mainly, but not exclusively, applied to developing countries.
Phillip S. Kott is an American statistician. He has worked in the field of survey statistics since 1984, and is regarded as a leader in this field. His areas of expertise include survey sampling design, analysis of survey data, and calibration weighting, among other areas. He revolutionized sampling design and estimation strategies with the Agricultural Resource Management Survey, which uses survey information more efficiently. He has taught at George Mason University, and USDA Graduate School. He is currently an Associate Editor for the Journal of Official Statistics and the scientific journal Survey Methodology.
The Indian Readership Survey (IRS) is the largest continuous readership research study in the world with an annual sample size exceeding 2.56 lakh (256,000) respondents. IRS collects a comprehensive range of demographic information and provides extensive coverage of consumer and product categories, including cars, household appliances, household durables, household care and personal care products, food and beverages, finance and holidays. IRS is not restricted to survey of readership alone but is synonymous with both readership and consumption across various FMCG products throughout India. IRS covers information on over 100 product categories. IRS is conducted by MRUC and RSCI.

Frauke Kreuter is a German sociologist and statistician. She is a professor of the Joint Program in Survey Methodology (JPSM) of the University of Maryland, College Park and a professor in statistics and data science at the Ludwig Maximilian University of Munich, Germany. Her research in survey methodology includes work on sampling error and observational error.
Jill A. Dever is an American statistician specializing in survey methodology who works as a senior researcher and senior director in the division for statistical & data sciences at RTI International.

Roderick Joseph Alexander Little is an academic statistician, whose main research contributions lie in the statistical analysis of data with missing values and the analysis of complex sample survey data. Little is Richard D. Remington Distinguished University Professor of Biostatistics in the Department of Biostatistics at the University of Michigan, where he also holds academic appointments in the Department of Statistics and the Institute for Social Research.
References
- ↑ "1. How different weighting methods work". 26 January 2018.
- ↑ Kalton, Graham; Flores-Cervantes, Ismael (2003). "Weighting Methods" (PDF). Journal of Official Statistics. 19 (2): 81–97.
- ↑ Battaglia, Michael; Izrael, David (2009). "Practical Considerations in Raking Survey Data". Survey Practice. 2 (5): 1–10. doi: 10.29115/SP-2009-0019 .
| | This statistics-related article is a stub. You can help Wikipedia by expanding it. |