Victorian state election, 2 March 1985 [1] Contents | ||||||
---|---|---|---|---|---|---|
Enrolled voters | 2,641,477 | |||||
Votes cast | 2,461,708 | Turnout | 93.19 | –0.67 | ||
Informal votes | 74,202 | Informal | 3.01 | –0.12 | ||
Summary of votes by party | ||||||
Party | Primary votes | % | Swing | Seats won | Seats held | |
Labor | 1,128,747 | 47.28 | –2.28 | 11 | 23 | |
Liberal | 982,418 | 41.15 | +1.94 | 8 | 16 | |
National | 159,299 | 6.67 | +1.17 | 3 | 5 | |
Democrats | 95,045 | 3.98 | –1.05 | 0 | 0 | |
Call to Australia | 16,849 | 0.71 | +0.71 | 0 | 0 | |
Independent | 5,148 | 0.22 | +0.04 | 0 | 0 | |
Total | 2,387,506 | 22 | 44 |
This is a list of Legislative Council results for the Victorian 1985 state election. 22 of the 44 seats were contested.
Party | Candidate | Votes | % | ±% | |
---|---|---|---|---|---|
Liberal | Dick de Fegely | 55,702 | 49.0 | ||
Labor | Roger Lowrey | 49,966 | 44.0 | ||
Democrats | William Ross | 8,009 | 7.0 | ||
Total formal votes | 113,677 | 98.0 | |||
Informal votes | 2,347 | 2.0 | |||
Turnout | 116,024 | 94.8 | |||
Two-party-preferred result | |||||
Liberal | Dick de Fegely | 57,851 | 50.9 | −1.0 | |
Labor | Roger Lowrey | 55,806 | 49.1 | +1.0 | |
Liberal hold | Swing | -1.0 | |||
Party | Candidate | Votes | % | ±% | |
---|---|---|---|---|---|
Liberal | Gerald Clarke | 51,150 | 48.0 | ||
Labor | Jean McLean | 48,531 | 45.6 | ||
Democrats | Sid Spindler | 6,831 | 6.4 | ||
Total formal votes | 106,512 | 97.5 | |||
Informal votes | 2,761 | 2.5 | |||
Turnout | 109,273 | 95.0 | |||
Two-party-preferred result | |||||
Labor | Jean McLean | 53,794 | 50.5 | −1.6 | |
Liberal | Gerald Clarke | 52,712 | 49.5 | +1.6 | |
Labor gain from Liberal | Swing | -1.6 | |||
Party | Candidate | Votes | % | ±% | |
---|---|---|---|---|---|
Liberal | Fred Grimwade | 51,045 | 46.7 | ||
Labor | Peter Fennell | 46,570 | 42.6 | ||
Democrats | Janet Powell | 5,920 | 5.4 | ||
Call to Australia | Brent Melville | 5,763 | 5.3 | ||
Total formal votes | 109,298 | 97.7 | |||
Informal votes | 2,622 | 2.3 | |||
Turnout | 111,920 | 93.3 | |||
Two-party-preferred result | |||||
Liberal | Fred Grimwade | 58,298 | 53.3 | +2.4 | |
Labor | Peter Fennell | 50,958 | 46.7 | −2.4 | |
Liberal hold | Swing | +2.4 | |||
Party | Candidate | Votes | % | ±% | |
---|---|---|---|---|---|
Labor | Maureen Lyster | 55,866 | 52.2 | ||
Liberal | Michael Herbst | 51,171 | 47.8 | ||
Total formal votes | 107,037 | 97.0 | |||
Informal votes | 3,321 | 3.0 | |||
Turnout | 110,358 | 93.2 | |||
Labor hold | Swing | -2.9 | |||
Party | Candidate | Votes | % | ±% | |
---|---|---|---|---|---|
Labor | David White | 68,820 | 63.9 | ||
Liberal | Pamela Philpot | 38,898 | 36.1 | ||
Total formal votes | 107,718 | 95.2 | |||
Informal votes | 5,462 | 4.8 | |||
Turnout | 113,180 | 94.2 | |||
Labor hold | Swing | -6.0 | |||
Party | Candidate | Votes | % | ±% | |
---|---|---|---|---|---|
Liberal | Mark Birrell | 63,782 | 58.0 | ||
Labor | Bernard Ziegenbein | 37,766 | 34.3 | ||
Democrats | Margaret Cole | 8,490 | 7.7 | ||
Total formal votes | 110,038 | 97.7 | |||
Informal votes | 2,616 | 2.3 | |||
Turnout | 112,654 | 92.0 | |||
Two-party-preferred result | |||||
Liberal | Mark Birrell | 68,003 | 61.8 | +4.4 | |
Labor | Bernard Ziegenbein | 42,035 | 38.2 | −4.4 | |
Liberal hold | Swing | +3.4 | |||
Party | Candidate | Votes | % | ±% | |
---|---|---|---|---|---|
Labor | Fred Van Buren | 62,352 | 59.8 | ||
Liberal | John Ferwerda | 41,846 | 40.2 | ||
Total formal votes | 104,198 | 95.4 | |||
Informal votes | 5,042 | 4.6 | |||
Turnout | 109,240 | 93.5 | |||
Labor hold | Swing | +0.9 | |||
Party | Candidate | Votes | % | ±% | |
---|---|---|---|---|---|
Labor | Rod Mackenzie | 58,009 | 53.1 | ||
Liberal | Joss Manders | 45,661 | 41.8 | ||
Democrats | Laurence Levy | 5,604 | 5.1 | ||
Total formal votes | 109,274 | 97.5 | |||
Informal votes | 2,796 | 2.5 | |||
Turnout | 112,070 | 94.2 | |||
Two-party-preferred result | |||||
Labor | Rod Mackenzie | 60,867 | 55.7 | −1.1 | |
Liberal | Joss Manders | 48,407 | 44.3 | +1.1 | |
Labor hold | Swing | -1.1 | |||
Party | Candidate | Votes | % | ±% | |
---|---|---|---|---|---|
Labor | Reginald Smith | 40,085 | 37.0 | ||
Liberal | Dick Long | 31,055 | 28.7 | ||
National | Anthony Stewart | 27,839 | 25.7 | ||
Call to Australia | Cornelius Gordyn | 4,615 | 4.3 | ||
Democrats | Catherine Stewart | 2,649 | 2.5 | ||
Independent | Ben Buckley | 2,005 | 1.9 | ||
Total formal votes | 108,248 | 97.7 | |||
Informal votes | 2,576 | 2.3 | |||
Turnout | 110,824 | 93.4 | |||
Two-party-preferred result | |||||
Liberal | Dick Long | 61,780 | 57.1 | +4.7 | |
Labor | Reginald Smith | 46,328 | 42.9 | −4.7 | |
Liberal hold | Swing | +4.7 | |||
Party | Candidate | Votes | % | ±% | |
---|---|---|---|---|---|
Liberal | Robert Lawson | 57,733 | 52.4 | ||
Labor | Denis Oakley | 45,329 | 41.2 | ||
Democrats | Anton Hermann | 7,039 | 6.4 | ||
Total formal votes | 110,101 | 97.3 | |||
Informal votes | 3,113 | 2.7 | |||
Turnout | 113,214 | 92.4 | |||
Two-party-preferred result | |||||
Liberal | Robert Lawson | 61,216 | 55.6 | +2.3 | |
Labor | Denis Oakley | 48,885 | 44.4 | −2.3 | |
Liberal hold | Swing | +2.3 | |||
Party | Candidate | Votes | % | ±% | |
---|---|---|---|---|---|
Labor | George Crawford | 73,242 | 67.9 | ||
Liberal | David Gandolfo | 34,690 | 32.1 | ||
Total formal votes | 107,932 | 95.5 | |||
Informal votes | 5,058 | 4.5 | |||
Turnout | 112,990 | 92.5 | |||
Labor hold | Swing | -2.1 | |||
Party | Candidate | Votes | % | ±% | |
---|---|---|---|---|---|
Labor | Evan Walker | 65,653 | 63.2 | ||
Liberal | Vincent Volpe | 31,621 | 30.4 | ||
Democrats | Simon James | 6,560 | 6.3 | ||
Total formal votes | 103,834 | 95.4 | |||
Informal votes | 4,966 | 4.6 | |||
Turnout | 108,800 | 88.6 | |||
Two-party-preferred result | |||||
Labor | Evan Walker | 68,946 | 66.4 | −4.5 | |
Liberal | Vincent Volpe | 34,888 | 33.6 | +4.5 | |
Labor hold | Swing | -4.5 | |||
Party | Candidate | Votes | % | ±% | |
---|---|---|---|---|---|
Labor | Giovanni Sgro | 71,366 | 67.6 | ||
Liberal | Brett Pullyblank | 34,135 | 32.4 | ||
Total formal votes | 105,501 | 95.2 | |||
Informal votes | 5,359 | 4.8 | |||
Turnout | 110,860 | 93.6 | |||
Labor hold | Swing | -4.1 | |||
Party | Candidate | Votes | % | ±% | |
---|---|---|---|---|---|
Labor | Joan Coxsedge | 68,229 | 62.9 | ||
Liberal | Matthew Matich | 31,474 | 29.0 | ||
Democrats | Johannus Paas | 8,821 | 8.1 | ||
Total formal votes | 108,524 | 95.7 | |||
Informal votes | 4,929 | 4.3 | |||
Turnout | 113,453 | 92.4 | |||
Two-party-preferred result | |||||
Labor | Joan Coxsedge | 72,603 | 66.9 | −4.8 | |
Liberal | Matthew Matich | 35,921 | 33.1 | +4.8 | |
Labor hold | Swing | -4.8 | |||
Party | Candidate | Votes | % | ±% | |
---|---|---|---|---|---|
Liberal | Reg Macey | 51,526 | 48.8 | ||
Labor | Bob Miller | 48,071 | 45.5 | ||
Democrats | David Collyer | 6,033 | 5.7 | ||
Total formal votes | 105,630 | 96.9 | |||
Informal votes | 3,352 | 3.1 | |||
Turnout | 108,982 | 89.0 | |||
Two-party-preferred result | |||||
Liberal | Reg Macey | 53,433 | 50.6 | +2.1 | |
Labor | Bob Miller | 52,177 | 49.4 | −2.1 | |
Liberal hold | Swing | +2.1 | |||
Party | Candidate | Votes | % | ±% | |
---|---|---|---|---|---|
National | Bill Baxter | 56,159 | 51.0 | ||
Labor | Ewan Paterson | 27,239 | 24.7 | ||
Liberal | Stephen Blair | 23,557 | 21.4 | ||
Independent | Michael Else | 3,143 | 2.9 | ||
Total formal votes | 110,098 | 97.7 | |||
Informal votes | 2,624 | 2.3 | |||
Turnout | 112,722 | 93.4 | |||
Two-party-preferred result | |||||
National | Bill Baxter | 75,747 | 68.8 | 0.0 | |
Labor | Ewan Paterson | 34,351 | 31.2 | 0.0 | |
National hold | Swing | 0.0 | |||
Party | Candidate | Votes | % | ±% | |
---|---|---|---|---|---|
National | Ken Wright | 41,144 | 37.6 | ||
Labor | Phillip Eddy | 36,168 | 33.1 | ||
Liberal | Bill Ebery | 32,041 | 29.3 | ||
Total formal votes | 109,353 | 98.2 | |||
Informal votes | 2,048 | 1.8 | |||
Turnout | 111,401 | 94.2 | |||
Two-party-preferred result | |||||
National | Ken Wright | 68,412 | 62.6 | +16.2 | |
Labor | Phillip Eddy | 40,867 | 37.4 | −16.2 | |
National hold | Swing | +16.2 | |||
Party | Candidate | Votes | % | ±% | |
---|---|---|---|---|---|
Liberal | Rosemary Varty | 50,584 | 46.1 | ||
Labor | Bob Ives | 50,220 | 45.8 | ||
Democrats | Michael Nardella | 8,855 | 8.1 | ||
Total formal votes | 109,659 | 97.7 | |||
Informal votes | 2,561 | 2.3 | |||
Turnout | 112,220 | 94.0 | |||
Two-party-preferred result | |||||
Labor | Bob Ives | 54,822* | 50.0 | −3.6 | |
Liberal | Rosemary Varty | 54,821 | 50.0 | +3.6 | |
Labor gain from Liberal | Swing | -3.6 | |||
Party | Candidate | Votes | % | ±% | |
---|---|---|---|---|---|
Liberal | Alan Hunt | 60,266 | 53.2 | ||
Labor | Bora Eric | 45,784 | 40.5 | ||
Democrats | Irene Fisher | 7,117 | 6.3 | ||
Total formal votes | 113,167 | 97.8 | |||
Informal votes | 2,567 | 2.2 | |||
Turnout | 115,734 | 93.7 | |||
Two-party-preferred result | |||||
Liberal | Alan Hunt | 63,713 | 56.3 | +2.7 | |
Labor | Bora Eric | 49,454 | 43.7 | −2.7 | |
Liberal hold | Swing | +2.7 | |||
Party | Candidate | Votes | % | ±% | |
---|---|---|---|---|---|
Liberal | John Miles | 53,726 | 49.7 | ||
Labor | Gary Greenway | 45,433 | 42.0 | ||
Democrats | Kenneth Peak | 8,917 | 8.3 | ||
Total formal votes | 108,076 | 97.5 | |||
Informal votes | 2,756 | 2.5 | |||
Turnout | 110,832 | 93.9 | |||
Two-party-preferred result | |||||
Liberal | John Miles | 57,104 | 52.8 | +2.3 | |
Labor | Gary Greenway | 50,958 | 47.2 | −2.3 | |
Liberal hold | Swing | +2.3 | |||
Party | Candidate | Votes | % | ±% | |
---|---|---|---|---|---|
Labor | Cyril Kennedy | 53,713 | 48.9 | ||
Liberal | Robert Clark | 45,362 | 41.3 | ||
Call to Australia | William Watson | 6,471 | 5.9 | ||
Democrats | Jeffrey McAlpine | 4,200 | 3.8 | ||
Total formal votes | 109,746 | 96.9 | |||
Informal votes | 3,524 | 3.1 | |||
Turnout | 113,270 | 93.8 | |||
Two-party-preferred result | |||||
Labor | Cyril Kennedy | 59,921 | 54.6 | +0.8 | |
Liberal | Robert Clark | 49,825 | 45.4 | −0.8 | |
Labor hold | Swing | +0.8 | |||
Party | Candidate | Votes | % | ±% | |
---|---|---|---|---|---|
Liberal | Henry Wyld | 45,393 | 41.3 | ||
National | Roger Hallam | 34,157 | 31.1 | ||
Labor | Brian Clarke | 30,335 | 27.6 | ||
Total formal votes | 109,885 | 98.4 | |||
Informal votes | 1,802 | 1.6 | |||
Turnout | 111,687 | 95.3 | |||
Two-candidate-preferred result | |||||
National | Roger Hallam | 60,064 | 54.7 | ||
Liberal | Henry Wyld | 49,821 | 45.3 | ||
National gain from Liberal | Swing | N/A | |||
Electoral systems of the Australian states and territories are broadly similar to the electoral system used in federal elections in Australia.
The Victorian Legislative Assembly is the state lower house of the bicameral Parliament of Victoria in Australia; the state upper house being the Victorian Legislative Council. Both houses sit at Parliament House in Spring Street, Melbourne. The main colour used for the upholstery and carpets furnishing the Chamber of the Legislative Assembly is green.
The Victorian Legislative Council (VLC) is the upper house of the bicameral Parliament of Victoria, Australia, the lower house being the Legislative Assembly. Both houses sit at Parliament House in Spring Street, Melbourne. The Legislative Council serves as a house of review, in a similar fashion to its federal counterpart, the Australian Senate. Although, it is possible for legislation to be first introduced in the Council, most bills receive their first hearing in the Legislative Assembly.
The Parliament of Victoria is the bicameral legislature of the Australian state of Victoria that follows a Westminster-derived parliamentary system. It consists of the King, represented by the governor of Victoria, the Legislative Assembly and the Legislative Council. It has a fused executive drawn from members of both chambers. The parliament meets at Parliament House in the state capital Melbourne. The current Parliament was elected on 26 November 2022, sworn in on 20 December 2022 and is the 60th parliament in Victoria.
The 2002 Victorian state election, held on Saturday, 30 November 2002, was for the 55th Parliament of Victoria. It was held to elect the 88 members of Victorian Legislative Assembly and 22 members of the 44-member Legislative Council.
The electoral district of Thomastown is an electorate of the Victorian Legislative Assembly. It currently includes the suburbs of Lalor and Thomastown, and parts of Fawkner, Reservoir and Wollert, and has been in existence since 1985.
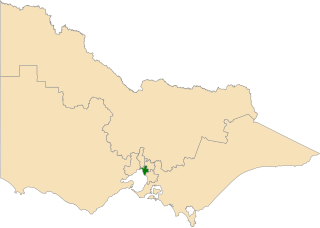
Southern Metropolitan Region is one of the eight electoral regions of Victoria, Australia, which elects five members to the Victorian Legislative Council by proportional representation. The region was created in 2006 following the 2005 reform of the Victorian Legislative Council.
The electoral district of Broadmeadows is an electorate of the Victorian Legislative Assembly. It covers an area of 47 square kilometres (18 sq mi) in outer northern Melbourne, and includes the suburbs of Broadmeadows, Campbellfield, Coolaroo, Dallas, Fawkner, Jacana and Meadow Heights. It also includes parts of Glenroy, Roxburgh Park, Somerton, and Westmeadows. It lies within the Northern Metropolitan Region of the upper house, the Legislative Council.
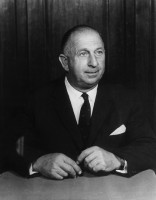
Elections were held in the Australian state of Victoria on 27 June 1964 to elect the 66 members of the state's Legislative Assembly and 17 members of the 34-member Legislative Council. The Liberal and Country Party (LCP) government of Premier Henry Bolte won a fourth term in office.
Vote 1 Local Jobs was a minor political party in the state of Victoria, Australia. It was registered as a political party by the Victorian Electoral Commission on 3 November 2014, in time for the 2014 state election.
The Nunawading Province by-election of 1985 was a by-election in the Nunawading Province for the Victorian Legislative Council held on 17 August 1985. It was ordered by the Court of Disputed Returns after the 1985 Victorian state election had resulted in a dead heat between the top two candidates, and the Chief Electoral Officer drew a name at random. The Chief Electoral Officer drew the name of the ALP candidate Bob Ives. After the Court ordered a new election, the outcome was that the Liberal candidate Rosemary Varty was returned.
This is a list of electoral district results for the Victorian 1985 election for the Legislative Assembly.
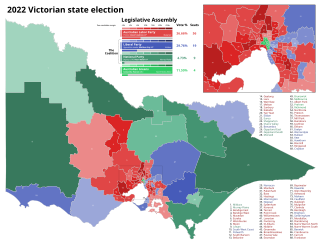
The 2022 Victorian state election was held on Saturday, 26 November 2022 to elect the 60th Parliament of Victoria. All 88 seats in the Legislative Assembly and all 40 seats in the Legislative Council were up for election at the time the writs were issued, however the election in the district of Narracan was deferred due to the death of a candidate.
This is a list of electoral results for the Nunawading Province in Victorian state elections.
This is a list of electoral results for the Geelong Province in Victorian state elections.
This is a list of electoral results for the Central Highlands Province in Victorian state elections.
This is a list of electoral results for the Ballarat Province in Victorian state elections.
This is a list of electoral results for the East Yarra Province in Victorian state elections.
This is a list of electoral results for the Melbourne Province in Victorian state elections.
The 2026 Victorian state election is expected to be held on 28 November 2026 to elect the 61st Parliament of Victoria. All 88 seats in the Legislative Assembly and all 40 seats in the Legislative Council will be up for election, presuming there are no new electorates added in a redistribution.