Victorian state election, 3 October 1992 [1] Contents | ||||||
---|---|---|---|---|---|---|
Enrolled voters | 2,855,471 | |||||
Votes cast | 2,718,936 | Turnout | 95.22 | +2.89 | ||
Informal votes | 111,627 | Informal | 4.11 | –0.22 | ||
Summary of votes by party | ||||||
Party | Primary votes | % | Swing | Seats won | Seats held | |
Liberal | 1,133,951 | 43.49 | –0.01 | 14 | 24 | |
Labor | 1,005,454 | 38.56 | –9.57 | 5 | 14 | |
National | 227,850 | 8.74 | +1.26 | 3 | 6 | |
Democratic Labor | 118,244 | 4.54 | +4.54 | 0 | 0 | |
Natural Law | 16,216 | 0.62 | +0.62 | 0 | 0 | |
Geelong Community Alliance | 14,586 | 0.56 | +0.56 | 0 | 0 | |
Democrats | 8,197 | 0.31 | +0.31 | 0 | 0 | |
Call to Australia | 2,168 | 0.08 | –0.14 | 0 | 0 | |
Independent | 80,643 | 3.09 | +2.42 | 0 | 0 | |
Total | 2,419,991 | 22 | 44 | |||
Two-party-preferred | ||||||
Liberal/National | 1,475,004 | 56.65 | +6.10 | |||
Labor | 1,128,503 | 43.35 | –6.10 |
This is a list of Legislative Council results for the Victorian 1992 state election. 22 of the 44 seats were contested.
Party | Candidate | Votes | % | ±% | |
---|---|---|---|---|---|
Liberal | Dick de Fegely | 62,482 | 53.9 | +5.2 | |
Labor | Geoff Howard | 47,384 | 40.9 | −3.3 | |
Democratic Labor | Brian Lugar | 6,110 | 5.3 | +5.3 | |
Total formal votes | 115,976 | 97.1 | −0.5 | ||
Informal votes | 3,488 | 2.9 | +0.5 | ||
Turnout | 119,464 | 96.2 | |||
Two-party-preferred result | |||||
Liberal | Dick de Fegely | 64,166 | 55.3 | +0.9 | |
Labor | Geoff Howard | 51,763 | 44.7 | −0.9 | |
Liberal hold | Swing | +0.9 | |||
Party | Candidate | Votes | % | ±% | |
---|---|---|---|---|---|
Liberal | Graeme Stoney | 69,009 | 58.5 | +18.8 | |
Labor | Janet Kaylock | 41,891 | 35.5 | −8.2 | |
Democratic Labor | Rosemary Maurus | 7,072 | 6.0 | +6.0 | |
Total formal votes | 117,972 | 96.7 | −0.1 | ||
Informal votes | 4,040 | 3.3 | +0.1 | ||
Turnout | 122,012 | 96.3 | |||
Two-party-preferred result | |||||
Liberal | Graeme Stoney | 71,733 | 60.9 | +7.7 | |
Labor | Janet Kaylock | 46,099 | 39.1 | −7.7 | |
Liberal hold | Swing | +7.7 | |||
Party | Candidate | Votes | % | ±% | |
---|---|---|---|---|---|
Liberal | Sue Wilding | 58,108 | 49.9 | +4.7 | |
Labor | Maureen Lyster | 47,127 | 40.5 | −11.4 | |
Independent | Judith O'Dwyer | 5,929 | 5.1 | +5.1 | |
Democratic Labor | John Cass | 5,199 | 4.5 | +4.5 | |
Total formal votes | 116,363 | 95.5 | +0.4 | ||
Informal votes | 5,455 | 4.5 | −0.4 | ||
Turnout | 121,818 | 95.3 | |||
Two-party-preferred result | |||||
Liberal | Sue Wilding | 62,868 | 54.2 | +7.6 | |
Labor | Maureen Lyster | 53,161 | 45.8 | −7.6 | |
Liberal gain from Labor | Swing | +7.6 | |||
Party | Candidate | Votes | % | ±% | |
---|---|---|---|---|---|
Labor | David White | 60,466 | 51.4 | −7.6 | |
Liberal | George Korytsky | 42,551 | 36.2 | −4.7 | |
Democratic Labor | Gloria Brook | 7,837 | 6.7 | +6.7 | |
Independent | Glenn Campbell | 6,772 | 5.8 | +5.8 | |
Total formal votes | 117,626 | 93.3 | +1.3 | ||
Informal votes | 8,394 | 6.7 | −1.3 | ||
Turnout | 126,020 | 95.0 | |||
Two-party-preferred result | |||||
Labor | David White | 68,027 | 58.0 | −1.1 | |
Liberal | George Korytsky | 49,257 | 42.0 | +1.1 | |
Labor hold | Swing | -1.1 | |||
Party | Candidate | Votes | % | ±% | |
---|---|---|---|---|---|
Liberal | Mark Birrell | 78,005 | 63.5 | +5.5 | |
Labor | Rosemary Barker | 37,038 | 30.1 | −11.8 | |
Democratic Labor | Margaret Reed | 7,840 | 6.4 | +6.4 | |
Total formal votes | 122,883 | 96.8 | +0.3 | ||
Informal votes | 4,068 | 3.2 | −0.3 | ||
Turnout | 126,951 | 94.5 | |||
Two-party-preferred result | |||||
Liberal | Mark Birrell | 81,579 | 66.4 | +8.4 | |
Labor | Rosemary Barker | 41,191 | 33.6 | −8.4 | |
Liberal hold | Swing | +8.4 | |||
Party | Candidate | Votes | % | ±% | |
---|---|---|---|---|---|
Liberal | Ron Wells | 60,726 | 52.6 | +6.0 | |
Labor | Fred Van Buren | 47,554 | 41.2 | −11.9 | |
Democratic Labor | Timothy Dodd | 7,115 | 6.2 | +6.2 | |
Total formal votes | 115,395 | 94.9 | +0.6 | ||
Informal votes | 6,237 | 5.1 | −0.6 | ||
Turnout | 121,632 | 95.2 | |||
Two-party-preferred result | |||||
Liberal | Ron Wells | 63,396 | 55.1 | +8.3 | |
Labor | Fred Van Buren | 51,745 | 44.9 | −8.3 | |
Liberal gain from Labor | Swing | +8.3 | |||
Party | Candidate | Votes | % | ±% | |
---|---|---|---|---|---|
Liberal | Bill Hartigan | 52,698 | 44.5 | +2.0 | |
Labor | Jan Alen | 47,263 | 39.9 | −8.6 | |
Geelong Community | Rod Mackenzie | 14,586 | 12.3 | +12.3 | |
Call to Australia | Ian Winter | 2,168 | 1.8 | −3.0 | |
Democratic Labor | Paul Cahill | 1,713 | 1.4 | +1.4 | |
Total formal votes | 118,428 | 96.5 | 0.0 | ||
Informal votes | 4,318 | 3.5 | 0.0 | ||
Turnout | 122,746 | 95.5 | |||
Two-party-preferred result | |||||
Liberal | Bill Hartigan | 62,863 | 53.2 | +4.3 | |
Labor | Jan Alen | 55,346 | 46.8 | −4.3 | |
Liberal gain from Labor | Swing | +4.3 | |||
Party | Candidate | Votes | % | ±% | |
---|---|---|---|---|---|
Liberal | Philip Davis | 62,713 | 52.5 | +23.9 | |
Labor | Judith Stone | 39,235 | 32.8 | −4.7 | |
Independent | Paul Newnham | 7,398 | 6.2 | +6.2 | |
Independent | Ben Buckley | 5,522 | 4.6 | +4.6 | |
Democratic Labor | Michael Rowe | 4,691 | 3.9 | +3.9 | |
Total formal votes | 119,559 | 97.3 | +0.2 | ||
Informal votes | 3,313 | 2.7 | −0.2 | ||
Turnout | 122,872 | 95.8 | |||
Two-party-preferred result | |||||
Liberal | Philip Davis | 73,891 | 61.9 | +3.9 | |
Labor | Judith Stone | 45,489 | 38.1 | −3.9 | |
Liberal hold | Swing | +3.9 | |||
Party | Candidate | Votes | % | ±% | |
---|---|---|---|---|---|
Liberal | Chris Strong | 74,382 | 62.0 | +7.2 | |
Labor | Thomas Hickie | 37,182 | 31.0 | −13.5 | |
Natural Law | Edward Havard | 5,088 | 4.2 | +4.2 | |
Democratic Labor | Gail de Rozario | 3,288 | 2.7 | +2.7 | |
Total formal votes | 119,940 | 96.4 | −0.1 | ||
Informal votes | 4,488 | 3.6 | +0.1 | ||
Turnout | 124,428 | 94.7 | |||
Two-party-preferred result | |||||
Liberal | Chris Strong | 77,462 | 64.7 | +9.5 | |
Labor | Thomas Hickie | 42,345 | 35.3 | −9.5 | |
Liberal hold | Swing | +9.5 | |||
Party | Candidate | Votes | % | ±% | |
---|---|---|---|---|---|
Labor | Pat Power | 66,472 | 55.5 | −9.7 | |
Liberal | Gregory Eade | 44,217 | 36.9 | +2.1 | |
Democratic Labor | Leonard Moore | 9,114 | 7.6 | +7.6 | |
Total formal votes | 119,803 | 94.5 | +1.2 | ||
Informal votes | 7,008 | 5.5 | −1.2 | ||
Turnout | 126,811 | 94.7 | |||
Two-party-preferred result | |||||
Labor | Pat Power | 73,325 | 61.3 | −3.9 | |
Liberal | Gregory Eade | 46,301 | 38.7 | +3.9 | |
Labor hold | Swing | -3.9 | |||
Party | Candidate | Votes | % | ±% | |
---|---|---|---|---|---|
Liberal | Bruce Atkinson | 69,900 | 57.8 | +7.4 | |
Labor | Sharon Ellis | 44,525 | 36.8 | −12.8 | |
Democratic Labor | Peter Ferwerda | 6,429 | 5.3 | +5.3 | |
Total formal votes | 120,854 | 96.2 | 0.0 | ||
Informal votes | 4,830 | 3.8 | 0.0 | ||
Turnout | 125,684 | 95.7 | |||
Two-party-preferred result | |||||
Liberal | Bruce Atkinson | 72,374 | 59.9 | +9.5 | |
Labor | Sharon Ellis | 48,361 | 40.1 | −9.5 | |
Liberal gain from Labor | Swing | +9.5 | |||
Party | Candidate | Votes | % | ±% | |
---|---|---|---|---|---|
Labor | Doug Walpole | 60,570 | 51.7 | −13.6 | |
Liberal | John Miles | 41,684 | 35.6 | +0.9 | |
Democrats | Robert Stone | 8,197 | 7.0 | +7.0 | |
Natural Law | Ngaire Mason | 4,298 | 3.7 | +3.7 | |
Democratic Labor | John Mulholland | 2,312 | 2.0 | +2.0 | |
Total formal votes | 117,061 | 94.4 | +1.0 | ||
Informal votes | 6,890 | 5.6 | −1.0 | ||
Turnout | 123,951 | 92.0 | |||
Two-party-preferred result | |||||
Labor | Doug Walpole | 68,723 | 58.9 | −6.4 | |
Liberal | John Miles | 48,016 | 41.1 | +6.4 | |
Labor hold | Swing | -6.4 | |||
Party | Candidate | Votes | % | ±% | |
---|---|---|---|---|---|
Labor | Don Nardella | 62,132 | 55.0 | −7.5 | |
Liberal | Alice Collis | 43,220 | 38.3 | +1.3 | |
Democratic Labor | Mark Beshara | 7,569 | 6.7 | +6.7 | |
Total formal votes | 112,921 | 94.1 | +0.9 | ||
Informal votes | 7,040 | 5.9 | −0.9 | ||
Turnout | 119,961 | 94.4 | |||
Two-party-preferred result | |||||
Labor | Don Nardella | 67,458 | 59.8 | −2.8 | |
Liberal | Alice Collis | 45,274 | 40.2 | +2.8 | |
Labor hold | Swing | -2.8 | |||
Party | Candidate | Votes | % | ±% | |
---|---|---|---|---|---|
Labor | Jean McLean | 51,960 | 44.9 | −18.2 | |
Liberal | Patricia Vejby | 34,543 | 29.9 | −7.0 | |
Independent | Les Twentyman | 26,499 | 22.9 | +22.9 | |
Democratic Labor | Maurice Allen | 2,693 | 2.3 | +2.3 | |
Total formal votes | 115,695 | 94.7 | +1.7 | ||
Informal votes | 6,520 | 5.3 | −1.7 | ||
Turnout | 122,215 | 95.2 | |||
Two-party-preferred result | |||||
Labor | Jean McLean | 64,176 | 55.6 | −7.5 | |
Liberal | Patricia Vejby | 51,199 | 44.4 | +7.5 | |
Labor hold | Swing | -7.5 | |||
Party | Candidate | Votes | % | ±% | |
---|---|---|---|---|---|
Liberal | Louise Asher | 69,705 | 56.5 | +4.9 | |
Labor | Bunna Walsh | 43,217 | 35.0 | −13.4 | |
Democratic Labor | Robert Semmel | 5,463 | 4.4 | +4.4 | |
Independent | James Moffatt | 4,982 | 4.0 | +4.0 | |
Total formal votes | 123,367 | 95.8 | +0.4 | ||
Informal votes | 5,470 | 4.2 | −0.4 | ||
Turnout | 128,837 | 93.7 | |||
Two-party-preferred result | |||||
Liberal | Louise Asher | 74,292 | 60.3 | +8.7 | |
Labor | Bunna Walsh | 48,862 | 39.7 | −8.7 | |
Liberal hold | Swing | +8.7 | |||
Party | Candidate | Votes | % | ±% | |
---|---|---|---|---|---|
National | Bill Baxter | 80,883 | 68.3 | +20.4 | |
Labor | Ewan Paterson | 31,526 | 26.6 | −0.7 | |
Democratic Labor | Pauline MacGibbon | 6,041 | 5.1 | +5.1 | |
Total formal votes | 118,450 | 97.0 | −0.5 | ||
Informal votes | 3,638 | 3.0 | +0.5 | ||
Turnout | 122,088 | 95.5 | |||
Two-party-preferred result | |||||
National | Bill Baxter | 84,065 | 71.0 | −0.2 | |
Labor | Ewan Paterson | 34,378 | 29.0 | +0.2 | |
National hold | Swing | -0.2 | |||
Party | Candidate | Votes | % | ±% | |
---|---|---|---|---|---|
National | Barry Bishop | 64,950 | 55.2 | +17.3 | |
Labor | Bob Cameron | 35,760 | 30.4 | −3.8 | |
Independent | Elizabeth Cox | 14,677 | 12.5 | +12.5 | |
Democratic Labor | Gavan Grimes | 2,297 | 2.0 | +2.0 | |
Total formal votes | 117,684 | 97.4 | −0.3 | ||
Informal votes | 3,119 | 2.6 | +0.3 | ||
Turnout | 120,803 | 96.1 | |||
Two-party-preferred result | |||||
National | Barry Bishop | 76,641 | 65.1 | +2.3 | |
Labor | Bob Cameron | 41,004 | 34.9 | −2.3 | |
National hold | Swing | +2.3 | |||
Party | Candidate | Votes | % | ±% | |
---|---|---|---|---|---|
Liberal | Rosemary Varty | 67,485 | 57.7 | +8.4 | |
Labor | Eugene O'Sullivan | 42,139 | 36.1 | −13.2 | |
Democratic Labor | Paul McCarthy | 7,251 | 6.2 | +6.2 | |
Total formal votes | 116,875 | 96.6 | −0.1 | ||
Informal votes | 4,053 | 3.4 | +0.1 | ||
Turnout | 120,928 | 95.3 | |||
Two-party-preferred result | |||||
Liberal | Rosemary Varty | 70,087 | 60.0 | +9.6 | |
Labor | Eugene O'Sullivan | 46,677 | 40.0 | −9.6 | |
Liberal hold | Swing | +9.6 | |||
Party | Candidate | Votes | % | ±% | |
---|---|---|---|---|---|
Liberal | Ron Bowden | 66,314 | 57.1 | +3.4 | |
Labor | Chrys Abraham | 38,811 | 33.4 | −12.7 | |
Natural Law | Alan Shield | 6,830 | 5.9 | +5.9 | |
Democratic Labor | Patrick Crea | 4,178 | 3.6 | +3.6 | |
Total formal votes | 116,133 | 96.5 | −0.1 | ||
Informal votes | 4,187 | 3.5 | +0.1 | ||
Turnout | 120,320 | 95.8 | |||
Two-party-preferred result | |||||
Liberal | Ron Bowden | 72,223 | 62.3 | +8.5 | |
Labor | Chrys Abraham | 43,738 | 37.7 | −8.5 | |
Liberal hold | Swing | +8.5 | |||
Party | Candidate | Votes | % | ±% | |
---|---|---|---|---|---|
Liberal | Bill Forwood | 73,029 | 59.4 | +8.1 | |
Labor | Desmond Johnson | 42,734 | 34.8 | −13.8 | |
Independent | Richard Fitzherbert | 3,899 | 3.2 | +3.2 | |
Democratic Labor | Valda McCarthy | 3,231 | 2.6 | +2.6 | |
Total formal votes | 122,893 | 95.9 | 0.0 | ||
Informal votes | 5,190 | 4.1 | 0.0 | ||
Turnout | 128,083 | 95.6 | |||
Two-party-preferred result | |||||
Liberal | Bill Forwood | 75,741 | 61.7 | +10.3 | |
Labor | Desmond Johnson | 47,032 | 38.3 | −10.3 | |
Liberal hold | Swing | +10.3 | |||
Party | Candidate | Votes | % | ±% | |
---|---|---|---|---|---|
Liberal | Andrew Brideson | 63,180 | 52.6 | +4.6 | |
Labor | Cyril Kennedy | 47,270 | 39.4 | −12.6 | |
Democratic Labor | Matthew Cody | 4,615 | 3.8 | +3.8 | |
Independent | Elizabeth Billing | 3,349 | 2.8 | +2.8 | |
Independent | Stephen Bingle | 1,616 | 1.3 | +1.3 | |
Total formal votes | 120,030 | 94.9 | −0.1 | ||
Informal votes | 6,420 | 5.1 | +0.1 | ||
Turnout | 126,450 | 96.0 | |||
Two-party-preferred result | |||||
Liberal | Andrew Brideson | 65,806 | 54.9 | +6.9 | |
Labor | Cyril Kennedy | 54,013 | 45.1 | −6.9 | |
Liberal gain from Labor | Swing | +6.9 | |||
Party | Candidate | Votes | % | ±% | |
---|---|---|---|---|---|
National | Roger Hallam | 82,017 | 67.6 | +45.9 | |
Labor | David Broderick | 33,198 | 27.3 | −0.7 | |
Democratic Labor | Christine Dodd | 6,186 | 5.1 | +5.1 | |
Total formal votes | 121,401 | 97.2 | −0.7 | ||
Informal votes | 3,461 | 2.8 | +0.7 | ||
Turnout | 124,862 | 96.6 | |||
Two-party-preferred result | |||||
National | Roger Hallam | 85,770 | 70.7 | +70.7 | |
Labor | David Broderick | 35,590 | 29.3 | −2.0 | |
National hold | Swing | +2.0 | |||
Gavin Wayne Jennings is an Australian politician. He was a Labor Party member of the Victorian Legislative Council from 1999 to 2020, representing Melbourne Province (1999–2006) and then the South Eastern Metropolitan Region (2006–2020). He was Leader of the Government in the Legislative Council and Special Minister of State in the Andrews Ministry from 2014 to 2020.
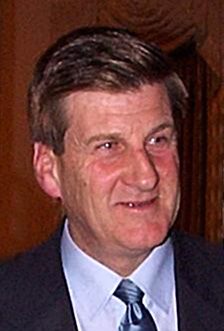
The 1996 Victorian state election, held on Saturday, 30 March 1996, was for the 53rd Parliament of Victoria. It was held in the Australian state of Victoria to elect all 88 members of the state's Legislative Assembly and 22 members of the 44-member Legislative Council. The election took place four weeks after the 1996 federal election which swept the Labor Party from power nationally.
The 1992 Victoria state election, held on Saturday, October 3. was for the 52nd Parliament of Victoria. It was held in the Australian state of Victoria to elect all 88 members of the state's Legislative Assembly and 22 members of the 44-member Legislative Council.
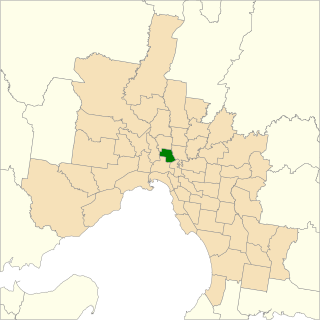
The electoral district of Brunswick is an electorate of the Victorian Legislative Assembly. It covers an area of 14 square kilometres (5.4 sq mi) in inner northern Melbourne, and includes the suburbs of Brunswick, Brunswick East, Carlton North, Fitzroy North, Princes Hill and parts of Brunswick West. It lies within the Northern Metropolitan Region of the upper house, the Legislative Council.
Seymour was an electoral district of the Victorian Legislative Assembly. It covered rural territory north of Melbourne, including the towns of Alexandra, Healesville, Kinglake, Marysville, Seymour and Yea.
This is a list of members of the Victorian Legislative Council between 1992 and 1996. As half of the Legislative Council's terms expired at each periodic election, half of these members were elected at the 1988 state election with terms expiring in 1996, while the other half were elected at the 1992 state election with terms intended to expire in 2000, but which lapsed at the 1999 state election.
This is a list of members of the Victorian Legislative Council between 1988 and 1992. As half of the Legislative Council's terms expired at each periodic election, half of these members were elected at the 1985 state election with terms expiring in 1992, while the other half were elected at the 1988 state election with terms expiring in 1996.
The Victorian Labor Party, officially known as the Australian Labor Party and commonly referred to simply as Victorian Labor, is the Victorian state branch of the Australian Labor Party (ALP). Victorian Labor forms the incumbent government in the state of Victoria and is led by Jacinta Allan, who has served concurrently as Premier of Victoria since 2023.
This is a list of electoral results for the Geelong Province in Victorian state elections.
This is a list of electoral results for the Chelsea Province in Victorian state elections.
This is a list of electoral results for the Central Highlands Province in Victorian state elections.
This is a list of electoral results for the Waverley Province in Victorian state elections.
This is a list of electoral results for the Templestowe Province in Victorian state elections.
This is a list of electoral results for the Monash Province in Victorian state elections.
This is a list of electoral results for the Melbourne West Province in Victorian state elections.
This is a list of electoral results for the Doutta Galla Province in Victorian state elections.
This is a list of electoral results for the Higinbotham Province in Victorian state elections.
This is a list of electoral results for the Melbourne Province in Victorian state elections.
This is a list of electoral results for the Gippsland Province in Victorian state elections.
This is a list of electoral results for the Western Province in Victorian state elections.