
Market capitalization, commonly called market cap, is the market value of a publicly traded company's outstanding shares.
A market trend is a perceived tendency of financial markets to move in a particular direction over time. These trends are classified as secular for long time frames, primary for medium time frames, and secondary for short time frames. Traders attempt to identify market trends using technical analysis, a framework which characterizes market trends as predictable price tendencies within the market when price reaches support and resistance levels, varying over time.
In finance, technical analysis is an analysis methodology for forecasting the direction of prices through the study of past market data, primarily price and volume. Behavioral economics and quantitative analysis use many of the same tools of technical analysis, which, being an aspect of active management, stands in contradiction to much of modern portfolio theory. The efficacy of both technical and fundamental analysis is disputed by the efficient-market hypothesis, which states that stock market prices are essentially unpredictable, and research on whether technical analysis offers any benefit has produced mixed results.
The relative strength index (RSI) is a technical indicator used in the analysis of financial markets. It is intended to chart the current and historical strength or weakness of a stock or market based on the closing prices of a recent trading period. The indicator should not be confused with relative strength.
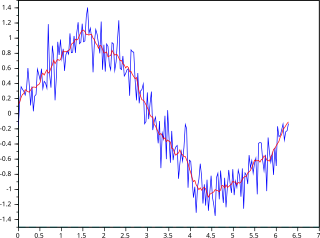
In statistics, a moving average is a calculation to analyze data points by creating a series of averages of different subsets of the full data set. It is also called a moving mean (MM) or rolling mean and is a type of finite impulse response filter. Variations include: simple, cumulative, or weighted forms.

MACD, short for moving average convergence/divergence, is a trading indicator used in technical analysis of stock prices, created by Gerald Appel in the late 1970s. It is designed to reveal changes in the strength, direction, momentum, and duration of a trend in a stock's price.

Bollinger Bands are a type of statistical chart characterizing the prices and volatility over time of a financial instrument or commodity, using a formulaic method propounded by John Bollinger in the 1980s. Financial traders employ these charts as a methodical tool to inform trading decisions, control automated trading systems, or as a component of technical analysis. Bollinger Bands display a graphical band and volatility in one two-dimensional chart.
In financial technical analysis, momentum (MTM) and rate of change (ROC) are simple indicators showing the difference between today's closing price and the close N days ago. Momentum is the absolute difference in stock, commodity:
Algorithmic trading is a method of executing orders using automated pre-programmed trading instructions accounting for variables such as time, price, and volume. This type of trading attempts to leverage the speed and computational resources of computers relative to human traders. In the twenty-first century, algorithmic trading has been gaining traction with both retail and institutional traders. It is widely used by investment banks, pension funds, mutual funds, and hedge funds that may need to spread out the execution of a larger order or perform trades too fast for human traders to react to. A study in 2019 showed that around 92% of trading in the Forex market was performed by trading algorithms rather than humans.

Keltner channel is a technical analysis indicator showing a central moving average line plus channel lines at a distance above and below. The indicator is named after Chester W. Keltner (1909–1998) who described it in his 1960 book How To Make Money in Commodities. This name was applied by those who heard about it from him, but Keltner called it the ten-day moving average trading rule and indeed made no claim to any originality for the idea.
The detrended price oscillator (DPO) is an indicator in technical analysis that attempts to eliminate the long-term trends in prices by using a displaced moving average so it does not react to the most current price action. This allows the indicator to show intermediate overbought and oversold levels effectively.
Nearly 78 years have passed since Paul L. Dysart, Jr. invented the Negative Volume Index and Positive Volume Index indicators. The indicators remain useful to identify primary market trends and reversals.
The Hindenburg Omen was a proposed technical analysis pattern, named after the Hindenburg disaster of May 6, 1937. It was created by Jim Miekka, who believed that it predicted stock market crashes.
The Coppock curve or Coppock indicator is a technical analysis indicator for long-term stock market investors created by E.S.C. Coppock, first published in Barron's Magazine on October 15, 1962.
The Kazakhstan Stock Exchange is a stock exchange located in Almaty, Kazakhstan. The exchange was founded in 1993.
Mean reversion is a financial term for the assumption that an asset's price will tend to converge to the average price over time.
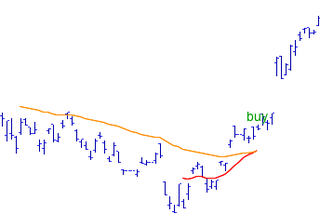
In the statistics of time series, and in particular the stock market technical analysis, a moving-average crossover occurs when, on plotting two moving averages each based on different degrees of smoothing, the traces of these moving averages cross. It does not predict future direction but shows trends. This indicator uses two moving averages, a slower moving average and a faster moving average. The faster moving average is a short term moving average. For end-of-day stock markets, for example, it may be 5-, 10- or 25-day period while the slower moving average is medium or long term moving average. A short term moving average is faster because it only considers prices over short period of time and is thus more reactive to daily price changes. On the other hand, a long term moving average is deemed slower as it encapsulates prices over a longer period and is more lethargic. However, it tends to smooth out price noises which are often reflected in short term moving averages.
The average directional movement index (ADX) was developed in 1978 by J. Welles Wilder as an indicator of trend strength in a series of prices of a financial instrument. ADX has become a widely used indicator for technical analysts, and is provided as a standard in collections of indicators offered by various trading platforms.
In financial technical analysis, the know sure thing (KST) oscillator is a complex, smoothed price velocity indicator developed by Martin J. Pring.
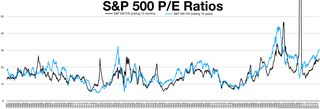
The cyclically adjusted price-to-earnings ratio, commonly known as CAPE, Shiller P/E, or P/E 10 ratio, is a valuation measure usually applied to the US S&P 500 equity market. It is defined as price divided by the average of ten years of earnings, adjusted for inflation. As such, it is principally used to assess likely future returns from equities over timescales of 10 to 20 years, with higher than average CAPE values implying lower than average long-term annual average returns.
