PostgreSQL, also known as Postgres, is a free and open-source relational database management system (RDBMS) emphasizing extensibility and SQL compliance. It was originally named POSTGRES, referring to its origins as a successor to the Ingres database developed at the University of California, Berkeley. In 1996, the project was renamed to PostgreSQL to reflect its support for SQL. After a review in 2007, the development team decided to keep the name PostgreSQL and the alias Postgres.
Simple Network Management Protocol (SNMP) is an Internet Standard protocol for collecting and organizing information about managed devices on IP networks and for modifying that information to change device behaviour. Devices that typically support SNMP include cable modems, routers, switches, servers, workstations, printers, and more.

Cacti is an open-source, web-based network monitoring, performance, fault and configuration management framework designed as a front-end application for the open-source, industry-standard data logging tool RRDtool. Cacti allows a user to poll services at predetermined intervals and graph the resulting data. Through the use of Cacti plugins, it has been extended to encompass all of the FCAPS operational management categories. It is generally used to graph time-series data of metrics such as CPU load and network bandwidth utilization. A common usage is to monitor network traffic by polling a network switch or router interface via Simple Network Management Protocol (SNMP).
FCAPS is the ISO Telecommunications Management Network model and framework for network management. FCAPS is an acronym for fault, configuration, accounting, performance, security, the management categories into which the ISO model defines network management tasks. In non-billing organizations accounting is sometimes replaced with administration.
Nagios Core, formerly known as Nagios, is a free and open-source computer-software application that monitors systems, networks and infrastructure. Nagios offers monitoring and alerting services for servers, switches, applications and services. It alerts users when things go wrong and alerts them a second time when the problem has been resolved.

The Multi Router Traffic Grapher (MRTG) is free software for monitoring and measuring the traffic load on network links. It allows the user to see traffic load on a network over time in graphical form.
Tsung is a stress testing tool written in the Erlang language and distributed under the GPL license. It can currently stress test HTTP, WebDAV, LDAP, MySQL, PostgreSQL, SOAP and XMPP servers. Tsung can simulate hundreds of simultaneous users on a single system. It can also function in a clustered environment.
Apcupsd, short for APC UPS daemon, is a utility that runs on Linux, UNIX, macOS and Windows. It allows the computer to interact with APC UPSes. Apcupsd also works with some OEM-branded products manufactured by APC.

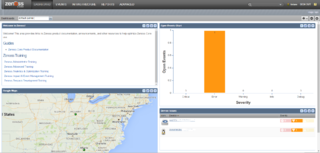
The company Zenoss, Inc. was founded in 2005 and is headquartered in Austin, Texas. The company develops hybrid IT monitoring and analytics software.

Pandora FMS is software for monitoring computer networks. Pandora FMS allows monitoring in a visual way the status and performance of several parameters from different operating systems, servers, applications and hardware systems such as firewalls, proxies, databases, web servers or routers.
OpenNMS is a free and open-source enterprise grade network monitoring and network management platform. It is developed and supported by a community of users and developers and by the OpenNMS Group, offering commercial services, training and support.
In computing, logging is the act of keeping a log of events that occur in a computer system, such as problems, errors or just information on current operations. These events may occur in the operating system or in other software. A message or log entry is recorded for each such event. These log messages can then be used to monitor and understand the operation of the system, to debug problems, or during an audit. Logging is particularly important in multi-user software, to have a central overview of the operation of the system.
The following tables compare general and technical information for a number of notable network monitoring systems. Please see the individual products' articles for further information.

Shinken is an open source computer system and network monitoring software application compatible with Nagios. It watches hosts and services, gathers performance data and alerts users when error conditions occur and again when the conditions clear.

Extromatica Network Monitor is a network monitoring application created and maintained by Extromatica company. It is designed to monitor network hardware, servers and network services for faults and performance degradation. It alerts users when things go wrong and again when they get better. The software supports a variety of real-time notification mechanisms, including Short Message Service (SMS).

Icinga is an open-source computer system and network monitoring application. It was originally created as a fork of the Nagios system monitoring application in 2009.
Checkmk is a software developed in Python and C++ for IT Infrastructure monitoring. It is used for the monitoring of servers, applications, networks, cloud infrastructures, containers, storage, databases and environment sensors.
PA Server Monitor is a server and network monitoring software from Power Admin LLC. PA Server Monitor focuses primarily on server and network health through numerous resource checks, reports, and alerting options. The agentless, on-premises software can monitor thousands of devices from a single installation. The monitored devices can be desktop computers, servers, routers and other devices.

Naemon is an open-source computer system monitoring, network monitoring and infrastructure monitoring software application. Naemon offers monitoring and alerting services for servers, switches, applications, and services. It alerts the users when things go wrong and alerts them a second time when the problem has been resolved. Naemon was created in 2014 as a fork of Nagios.

Octopussy, also known as 8Pussy, is a free and open-source computer-software which monitors systems, by constantly analyzing the syslog data they generate and transmit to such a central Octopussy server. Therefore, software like Octopussy plays an important role in maintaining an information security management system within ISO/IEC 27001-compliant environments.


