
Seismology is the scientific study of earthquakes and the generation and propagation of elastic waves through planetary bodies. It also includes studies of the environmental effects of earthquakes such as tsunamis; other seismic sources such as volcanoes, plate tectonics, glaciers, rivers, oceanic microseisms, and the atmosphere; and artificial processes such as explosions.
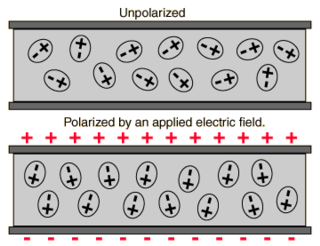
In electromagnetism, the absolute permittivity, often simply called permittivity and denoted by the Greek letter ε (epsilon), is a measure of the electric polarizability of a dielectric material. A material with high permittivity polarizes more in response to an applied electric field than a material with low permittivity, thereby storing more energy in the material. In electrostatics, the permittivity plays an important role in determining the capacitance of a capacitor.

A seismic wave is a mechanical wave of acoustic energy that travels through the Earth or another planetary body. It can result from an earthquake, volcanic eruption, magma movement, a large landslide and a large man-made explosion that produces low-frequency acoustic energy. Seismic waves are studied by seismologists, who record the waves using seismometers, hydrophones, or accelerometers. Seismic waves are distinguished from seismic noise, which is persistent low-amplitude vibration arising from a variety of natural and anthropogenic sources.

The epicenter, epicentre, or epicentrum in seismology is the point on the Earth's surface directly above a hypocenter or focus, the point where an earthquake or an underground explosion originates.

In mathematics, the complex plane is the plane formed by the complex numbers, with a Cartesian coordinate system such that the horizontal x-axis, called the real axis, is formed by the real numbers, and the vertical y-axis, called the imaginary axis, is formed by the imaginary numbers.

A seismometer is an instrument that responds to ground displacement and shaking such as caused by quakes, volcanic eruptions, and explosions. They are usually combined with a timing device and a recording device to form a seismograph. The output of such a device—formerly recorded on paper or film, now recorded and processed digitally—is a seismogram. Such data is used to locate and characterize earthquakes, and to study the internal structure of Earth.

A seismogram is a graph output by a seismograph. It is a record of the ground motion at a measuring station as a function of time. Seismograms typically record motions in three cartesian axes, with the z axis perpendicular to the Earth's surface and the x- and y- axes parallel to the surface. The energy measured in a seismogram may result from an earthquake or from some other source, such as an explosion. Seismograms can record many things, and record many little waves, called microseisms. These tiny events can be caused by heavy traffic near the seismograph, waves hitting a beach, the wind, and any number of other ordinary things that cause some shaking of the seismograph.

In mathematics, physics, electronics, control systems engineering, and statistics, the frequency domain refers to the analysis of mathematical functions or signals with respect to frequency, rather than time, as in time series. Put simply, a time-domain graph shows how a signal changes over time, whereas a frequency-domain graph shows how the signal is distributed within different frequency bands over a range of frequencies. A complex valued frequency-domain representation consists of both the magnitude and the phase of a set of sinusoids at the frequency components of the signal. Although it is common to refer to the magnitude portion as the frequency response of a signal, the phase portion is required to uniquely define the signal.
In mathematics and signal processing, an analytic signal is a complex-valued function that has no negative frequency components. The real and imaginary parts of an analytic signal are real-valued functions related to each other by the Hilbert transform.

A response spectrum is a plot of the peak or steady-state response of a series of oscillators of varying natural frequency, that are forced into motion by the same base vibration or shock. The resulting plot can then be used to pick off the response of any linear system, given its natural frequency of oscillation. One such use is in assessing the peak response of buildings to earthquakes. The science of strong ground motion may use some values from the ground response spectrum for correlation with seismic damage.
The Kramers–Kronig relations, sometimes abbreviated as KK relations, are bidirectional mathematical relations, connecting the real and imaginary parts of any complex function that is analytic in the upper half-plane. The relations are often used to compute the real part from the imaginary part of response functions in physical systems, because for stable systems, causality implies the condition of analyticity, and conversely, analyticity implies causality of the corresponding stable physical system. The relation is named in honor of Ralph Kronig and Hans Kramers. In mathematics, these relations are known by the names Sokhotski–Plemelj theorem and Hilbert transform.

Instantaneous phase and frequency are important concepts in signal processing that occur in the context of the representation and analysis of time-varying functions. The instantaneous phase (also known as local phase or simply phase) of a complex-valued function s(t), is the real-valued function:
The receiver function technique is a way to image the structure of the Earth and its internal boundaries by using the information from teleseismic earthquakes recorded at a three-component seismograph.
The Richter scale, also called the Richter magnitude scale, Richter's magnitude scale, and the Gutenberg–Richter scale, is a measure of the strength of earthquakes, developed by Charles Richter in collaboration with Beno Gutenberg, and presented in Richter's landmark 1935 paper, where he called it the "magnitude scale". This was later revised and renamed the local magnitude scale, denoted as ML or ML .
A series of small volcanic earthquakes measuring less than 4.0 on the Richter magnitude scale took place in the sparsely populated Nazko area of the Central Interior of British Columbia, Canada, from October 9, 2007, to June 12, 2008. They occurred just west of Nazko Cone, a small tree-covered cinder cone that last erupted about 7,200 years ago.
In reflection seismology, a seismic attribute is a quantity extracted or derived from seismic data that can be analysed in order to enhance information that might be more subtle in a traditional seismic image, leading to a better geological or geophysical interpretation of the data. Examples of seismic attributes can include measured time, amplitude, frequency and attenuation, in addition to combinations of these. Most seismic attributes are post-stack, but those that use CMP gathers, such as amplitude versus offset (AVO), must be analysed pre-stack. They can be measured along a single seismic trace or across multiple traces within a defined window.

Interferometry examines the general interference phenomena between pairs of signals in order to gain useful information about the subsurface. Seismic interferometry (SI) utilizes the crosscorrelation of signal pairs to reconstruct the impulse response of a given media. Papers by Keiiti Aki (1957), Géza Kunetz, and Jon Claerbout (1968) helped develop the technique for seismic applications and provided the framework upon which modern theory is based.
Recent advances are improving the speed and accuracy of loss estimates immediately after earthquakes so that injured people may be rescued more efficiently. "Casualties" are defined as fatalities and injured people, which are due to damage to occupied buildings. After major and large earthquakes, rescue agencies and civil defense managers rapidly need quantitative estimates of the extent of the potential disaster, at a time when information from the affected area may not yet have reached the outside world. For the injured below the rubble every minute counts. To rapidly provide estimates of the extent of an earthquake disaster is much less of a problem in industrialized than in developing countries. This article focuses on how one can estimate earthquake losses in developing countries in real time.
Dispersive body waves is an important aspect of seismic theory. When a wave propagates through subsurface materials both energy dissipation and velocity dispersion takes place. Energy dissipation is frequency dependent and causes decreased resolution of the seismic images when recorded in seismic prospecting. The attendant dispersion is a necessary consequence of the energy dissipation and causes the high frequency waves to travel faster than the low-frequency waves. The consequence for the seismic image is a frequency dependent time-shift of the data, and so correct timings for lithological identification cannot be obtained.

Frank Rieber was a pioneering geophysicist, entrepreneur, inventor, and innovator, and made advances in a variety of fields. He is particularly remembered for his groundbreaking research in automated seismic data processing, decades before the industry performed similar research. His patents related to reproducible seismograms would lead to the ability to better locate petroleum, and gain widespread use and recognition by improving the fidelity of seismographs in accurately depicting underground rock strata and oil structures, particularly in areas with complex geological formations.