
Depth-first search (DFS) is an algorithm for traversing or searching tree or graph data structures. The algorithm starts at the root node and explores as far as possible along each branch before backtracking. Extra memory, usually a stack, is needed to keep track of the nodes discovered so far along a specified branch which helps in backtracking of the graph.

In the mathematical field of graph theory, a bipartite graph is a graph whose vertices can be divided into two disjoint and independent sets and , that is, every edge connects a vertex in to one in . Vertex sets and are usually called the parts of the graph. Equivalently, a bipartite graph is a graph that does not contain any odd-length cycles.
In graph theory, a branch of mathematics, the (binary) cycle space of an undirected graph is the set of its even-degree subgraphs.
This is a glossary of graph theory. Graph theory is the study of graphs, systems of nodes or vertices connected in pairs by lines or edges.
In discrete mathematics, particularly in graph theory, a graph is a structure consisting of a set of objects where some pairs of the objects are in some sense "related". The objects are represented by abstractions called vertices and each of the related pairs of vertices is called an edge. Typically, a graph is depicted in diagrammatic form as a set of dots or circles for the vertices, joined by lines or curves for the edges.
In graph theory, an Eulerian trail is a trail in a finite graph that visits every edge exactly once. Similarly, an Eulerian circuit or Eulerian cycle is an Eulerian trail that starts and ends on the same vertex. They were first discussed by Leonhard Euler while solving the famous Seven Bridges of Königsberg problem in 1736. The problem can be stated mathematically like this:
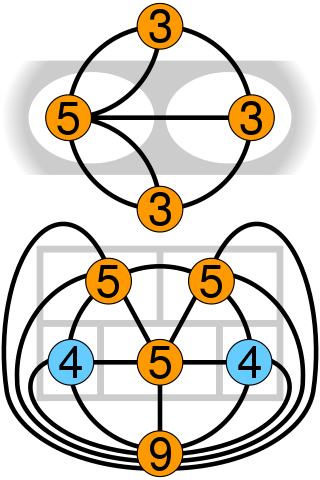
In mathematics, an incidence matrix is a logical matrix that shows the relationship between two classes of objects, usually called an incidence relation. If the first class is X and the second is Y, the matrix has one row for each element of X and one column for each element of Y. The entry in row x and column y is 1 if x and y are related and 0 if they are not. There are variations; see below.

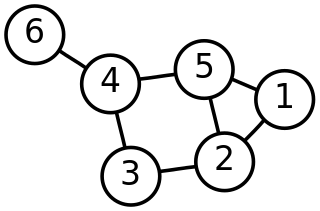
In graph theory, a proper edge coloring of a graph is an assignment of "colors" to the edges of the graph so that no two incident edges have the same color. For example, the figure to the right shows an edge coloring of a graph by the colors red, blue, and green. Edge colorings are one of several different types of graph coloring. The edge-coloring problem asks whether it is possible to color the edges of a given graph using at most k different colors, for a given value of k, or with the fewest possible colors. The minimum required number of colors for the edges of a given graph is called the chromatic index of the graph. For example, the edges of the graph in the illustration can be colored by three colors but cannot be colored by two colors, so the graph shown has chromatic index three.
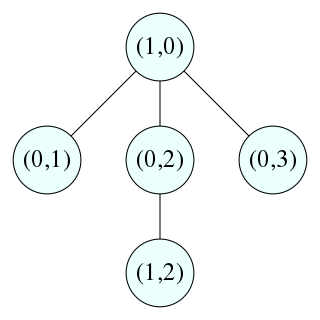
In computer science, a topological sort or topological ordering of a directed graph is a linear ordering of its vertices such that for every directed edge (u,v) from vertex u to vertex v, u comes before v in the ordering. For instance, the vertices of the graph may represent tasks to be performed, and the edges may represent constraints that one task must be performed before another; in this application, a topological ordering is just a valid sequence for the tasks. Precisely, a topological sort is a graph traversal in which each node v is visited only after all its dependencies are visited. A topological ordering is possible if and only if the graph has no directed cycles, that is, if it is a directed acyclic graph (DAG). Any DAG has at least one topological ordering, and algorithms are known for constructing a topological ordering of any DAG in linear time. Topological sorting has many applications, especially in ranking problems such as feedback arc set. Topological sorting is possible even when the DAG has disconnected components.

In statistical mechanics and mathematics, the Bethe lattice is an infinite connected cycle-free graph where all vertices have the same number of neighbors. The Bethe lattice was introduced into the physics literature by Hans Bethe in 1935. In such a graph, each node is connected to z neighbors; the number z is called either the coordination number or the degree, depending on the field.
In graph theory, a branch of mathematics, the circuit rank, cyclomatic number, cycle rank, or nullity of an undirected graph is the minimum number of edges that must be removed from the graph to break all its cycles, making it into a tree or forest. It is equal to the number of independent cycles in the graph. Unlike the corresponding feedback arc set problem for directed graphs, the circuit rank r is easily computed using the formula
In graph theory, an n-dimensional De Bruijn graph of m symbols is a directed graph representing overlaps between sequences of symbols. It has mn vertices, consisting of all possible length-n sequences of the given symbols; the same symbol may appear multiple times in a sequence. For a set of m symbols S = {s1, …, sm}, the set of vertices is:
In graph theory, reachability refers to the ability to get from one vertex to another within a graph. A vertex can reach a vertex if there exists a sequence of adjacent vertices which starts with and ends with .

In graph theory, a cactus is a connected graph in which any two simple cycles have at most one vertex in common. Equivalently, it is a connected graph in which every edge belongs to at most one simple cycle, or in which every block is an edge or a cycle.

In mathematics, and more specifically in graph theory, a directed graph is a graph that is made up of a set of vertices connected by directed edges, often called arcs.
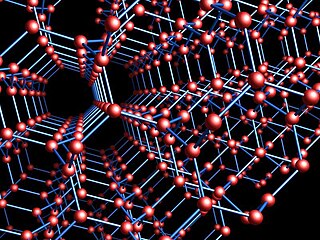
In geometry and crystallography, the Laves graph is an infinite and highly symmetric system of points and line segments in three-dimensional Euclidean space, forming a periodic graph. Three equal-length segments meet at 120° angles at each point, and all cycles use ten or more segments. It is the shortest possible triply periodic graph, relative to the volume of its fundamental domain. One arrangement of the Laves graph uses one out of every eight of the points in the integer lattice as its points, and connects all pairs of these points that are nearest neighbors, at distance . It can also be defined, divorced from its geometry, as an abstract undirected graph, a covering graph of the complete graph on four vertices.

The double cut and join (DCJ) model is a model for genome rearrangement used to define an edit distance between genomes based on gene order and orientation, rather than nucleotide sequence. It takes the fundamental units of a genome to be synteny blocks, maximal sections of DNA conserved between genomes. It focuses on changes due to genome rearrangement operations such as inversions, translocations as well as the creation and absorption of circular intermediates.
In mathematics, and more specifically in combinatorial commutative algebra, a zero-divisor graph is an undirected graph representing the zero divisors of a commutative ring. It has elements of the ring as its vertices, and pairs of elements whose product is zero as its edges.

In graph theory, a locally linear graph is an undirected graph in which every edge belongs to exactly one triangle. Equivalently, for each vertex of the graph, its neighbors are each adjacent to exactly one other neighbor, so the neighbors can be paired up into an induced matching. Locally linear graphs have also been called locally matched graphs. Their triangles form the hyperedges of triangle-free 3-uniform linear hypergraphs and the blocks of certain partial Steiner triple systems, and the locally linear graphs are exactly the Gaifman graphs of these hypergraphs or partial Steiner systems.
In algebraic topology and graph theory, graph homology describes the homology groups of a graph, where the graph is considered as a topological space. It formalizes the idea of the number of "holes" in the graph. It is a special case of a simplicial homology, as a graph is a special case of a simplicial complex. Since a finite graph is a 1-complex, the only non-trivial homology groups are the 0-th group and the 1-th group.


