Related Research Articles
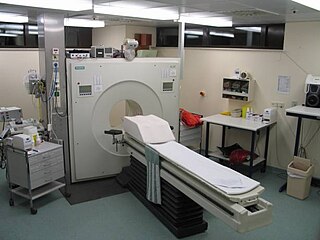
Positron emission tomography (PET) is a functional imaging technique that uses radioactive substances known as radiotracers to visualize and measure changes in metabolic processes, and in other physiological activities including blood flow, regional chemical composition, and absorption. Different tracers are used for various imaging purposes, depending on the target process within the body. For example, 18
F
-FDG is commonly used to detect cancer, NaF18
F
is widely used for detecting bone formation, and oxygen-15 is sometimes used to measure blood flow.
Statistics is a field of inquiry that studies the collection, analysis, interpretation, and presentation of data. It is applicable to a wide variety of academic disciplines, from the physical and social sciences to the humanities; it is also used and misused for making informed decisions in all areas of business and government.
Importance sampling is a Monte Carlo method for evaluating properties of a particular distribution, while only having samples generated from a different distribution than the distribution of interest. Its introduction in statistics is generally attributed to a paper by Teun Kloek and Herman K. van Dijk in 1978, but its precursors can be found in statistical physics as early as 1949. Importance sampling is also related to umbrella sampling in computational physics. Depending on the application, the term may refer to the process of sampling from this alternative distribution, the process of inference, or both.
In statistics, sometimes the covariance matrix of a multivariate random variable is not known but has to be estimated. Estimation of covariance matrices then deals with the question of how to approximate the actual covariance matrix on the basis of a sample from the multivariate distribution. Simple cases, where observations are complete, can be dealt with by using the sample covariance matrix. The sample covariance matrix (SCM) is an unbiased and efficient estimator of the covariance matrix if the space of covariance matrices is viewed as an extrinsic convex cone in Rp×p; however, measured using the intrinsic geometry of positive-definite matrices, the SCM is a biased and inefficient estimator. In addition, if the random variable has a normal distribution, the sample covariance matrix has a Wishart distribution and a slightly differently scaled version of it is the maximum likelihood estimate. Cases involving missing data, heteroscedasticity, or autocorrelated residuals require deeper considerations. Another issue is the robustness to outliers, to which sample covariance matrices are highly sensitive.
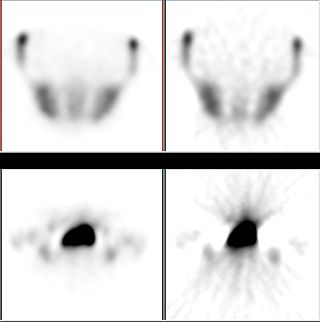
Iterative reconstruction refers to iterative algorithms used to reconstruct 2D and 3D images in certain imaging techniques. For example, in computed tomography an image must be reconstructed from projections of an object. Here, iterative reconstruction techniques are usually a better, but computationally more expensive alternative to the common filtered back projection (FBP) method, which directly calculates the image in a single reconstruction step. In recent research works, scientists have shown that extremely fast computations and massive parallelism is possible for iterative reconstruction, which makes iterative reconstruction practical for commercialization.

In statistics, kernel density estimation (KDE) is the application of kernel smoothing for probability density estimation, i.e., a non-parametric method to estimate the probability density function of a random variable based on kernels as weights. KDE answers a fundamental data smoothing problem where inferences about the population are made, based on a finite data sample. In some fields such as signal processing and econometrics it is also termed the Parzen–Rosenblatt window method, after Emanuel Parzen and Murray Rosenblatt, who are usually credited with independently creating it in its current form. One of the famous applications of kernel density estimation is in estimating the class-conditional marginal densities of data when using a naive Bayes classifier, which can improve its prediction accuracy.
In neuroimaging, spatial normalization is an image processing step, more specifically an image registration method. Human brains differ in size and shape, and one goal of spatial normalization is to deform human brain scans so one location in one subject's brain scan corresponds to the same location in another subject's brain scan.

In scientific visualization, a maximum intensity projection (MIP) is a method for 3D data that projects in the visualization plane the voxels with maximum intensity that fall in the way of parallel rays traced from the viewpoint to the plane of projection. This implies that two MIP renderings from opposite viewpoints are symmetrical images if they are rendered using orthographic projection.
In statistical signal processing, the goal of spectral density estimation (SDE) or simply spectral estimation is to estimate the spectral density of a signal from a sequence of time samples of the signal. Intuitively speaking, the spectral density characterizes the frequency content of the signal. One purpose of estimating the spectral density is to detect any periodicities in the data, by observing peaks at the frequencies corresponding to these periodicities.
In various science/engineering applications, such as independent component analysis, image analysis, genetic analysis, speech recognition, manifold learning, and time delay estimation it is useful to estimate the differential entropy of a system or process, given some observations.
In statistics, adaptive or "variable-bandwidth" kernel density estimation is a form of kernel density estimation in which the size of the kernels used in the estimate are varied depending upon either the location of the samples or the location of the test point. It is a particularly effective technique when the sample space is multi-dimensional.

Positron emission tomography–magnetic resonance imaging (PET–MRI) is a hybrid imaging technology that incorporates magnetic resonance imaging (MRI) soft tissue morphological imaging and positron emission tomography (PET) functional imaging.

In non-parametric statistics, the Theil–Sen estimator is a method for robustly fitting a line to sample points in the plane by choosing the median of the slopes of all lines through pairs of points. It has also been called Sen's slope estimator, slope selection, the single median method, the Kendall robust line-fit method, and the Kendall–Theil robust line. It is named after Henri Theil and Pranab K. Sen, who published papers on this method in 1950 and 1968 respectively, and after Maurice Kendall because of its relation to the Kendall tau rank correlation coefficient.

The computed tomography imaging spectrometer (CTIS) is a snapshot imaging spectrometer which can produce in fine the three-dimensional hyperspectral datacube of a scene.
Multidimension spectral estimation is a generalization of spectral estimation, normally formulated for one-dimensional signals, to multidimensional signals or multivariate data, such as wave vectors.
Preclinical or small-animal Single Photon Emission Computed Tomography (SPECT) is a radionuclide based molecular imaging modality for small laboratory animals. Although SPECT is a well-established imaging technique that is already for decades in use for clinical application, the limited resolution of clinical SPECT (~10 mm) stimulated the development of dedicated small animal SPECT systems with sub-mm resolution. Unlike in clinics, preclinical SPECT outperforms preclinical coincidence PET in terms of resolution and, at the same time, allows to perform fast dynamic imaging of animals.

Michael Ira Miller is an American-born biomedical engineer and data scientist, and the Bessie Darling Massey Professor and Director of the Johns Hopkins University Department of Biomedical Engineering. He worked with Ulf Grenander in the field of Computational Anatomy as it pertains to neuroscience, specializing in mapping the brain under various states of health and disease by applying data derived from medical imaging. Miller is the director of the Johns Hopkins Center for Imaging Science, Whiting School of Engineering and codirector of Johns Hopkins Kavli Neuroscience Discovery Institute. Miller is also a Johns Hopkins University Gilman Scholar.
Xiaohong Chen is a Chinese economist who currently serves as the Malcolm K. Brachman Professor of Economics at Yale University. She is a fellow of the Econometric Society and a laureate of the China Economics Prize. As one of the leading experts in econometrics, her research focuses on econometric theory, Semi/nonparametric estimation and inference methods, Sieve methods, Nonlinear time series, and Semi/nonparametric models. She was elected to the American Academy of Arts and Sciences in 2019.
Arterial input function (AIF), also known as a plasma input function, refers to the concentration of tracer in blood-plasma in an artery measured over time. The oldest record on PubMed shows that AIF was used by Harvey et al. in 1962 to measure the exchange of materials between red blood cells and blood plasma, and by other researchers in 1983 for positron emission tomography (PET) studies. Nowadays, kinetic analysis is performed in various medical imaging techniques, which requires an AIF as one of the inputs to the mathematical model, for example, in dynamic PET imaging, or perfusion CT, or dynamic contrast-enhanced magnetic resonance imaging (DCE-MRI).
References
- ↑ Snyder, Donald L.; Miller, Michael I. (1985). "On the Use of the Method of Sieves for Positron Emission Tomography". IEEE Transactions on Medical Imaging. NS-32(5): 3864–3872. doi:10.1109/TNS.1985.4334521.
- ↑ Shepp, Larry; Vardi, Yehuda (1982). "Maximum Likelihood Reconstruction for Emission Tomography". IEEE Transactions on Medical Imaging. 1 (2): 113–22. doi:10.1109/TMI.1982.4307558. PMID 18238264.