Related Research Articles

Microsoft Excel is a spreadsheet developed by Microsoft for Windows, macOS, Android and iOS. It features calculation or computation capabilities, graphing tools, pivot tables, and a macro programming language called Visual Basic for Applications (VBA). Excel forms part of the Microsoft Office suite of software.
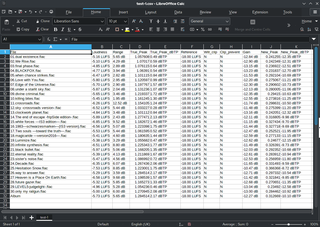
A spreadsheet is a computer application for computation, organization, analysis and storage of data in tabular form. Spreadsheets were developed as computerized analogs of paper accounting worksheets. The program operates on data entered in cells of a table. Each cell may contain either numeric or text data, or the results of formulas that automatically calculate and display a value based on the contents of other cells. A spreadsheet may also refer to one such electronic document.
Maple is a symbolic and numeric computing environment as well as a multi-paradigm programming language. It covers several areas of technical computing, such as symbolic mathematics, numerical analysis, data processing, visualization, and others. A toolbox, MapleSim, adds functionality for multidomain physical modeling and code generation.

Windows Calculator is a software calculator developed by Microsoft and included in Windows. It has four modes: standard, scientific, programmer, and a graphing mode. The standard mode includes a number pad and buttons for performing arithmetic operations. The scientific mode takes this a step further and adds exponents and trigonometric function, and programmer mode allows the user to perform operations related to computer programming. Recently, a graphing mode was added to the Calculator, allowing users to graph equations on a coordinate plane.
A GIS software program is a computer program to support the use of a geographic information system, providing the ability to create, store, manage, query, analyze, and visualize geographic data, that is, data representing phenomena for which location is important. The GIS software industry encompasses a broad range of commercial and open-source products that provide some or all of these capabilities within various information technology architectures.

Analysis of Functional NeuroImages (AFNI) is an open-source environment for processing and displaying functional MRI data—a technique for mapping human brain activity.

LabPlot is a free software and cross-platform computer program for interactive scientific graphing and data analysis, written for the KDE desktop. It is similar to Origin and is able to import Origin's data files.
Origin is a proprietary computer program for interactive scientific graphing and data analysis. It is produced by OriginLab Corporation, and runs on Microsoft Windows. It has inspired several platform-independent open-source clones and alternatives like LabPlot and SciDAVis.

The KDE Education Project develops free educational software based on the KDE technologies for students and parents. These educational software is translated into more than 65 languages, so that users can access them without any problems. The KDE-Edu project also provides free software educational to support and facilitate teachers in planning lessons.

VisIt is an open-source interactive parallel visualization and graphical analysis tool for viewing scientific data. It can be used to visualize scalar and vector fields defined on 2D and 3D structured and unstructured meshes. VisIt was designed to handle very large data set sizes in the terascale range and yet can also handle small data sets in the kilobyte range.
PSPP is a free software application for analysis of sampled data, intended as a free alternative for IBM SPSS Statistics. It has a graphical user interface and conventional command-line interface. It is written in C and uses GNU Scientific Library for its mathematical routines. The name has "no official acronymic expansion".
Cultural analytics refers to the use of computational, visualization, and big data methods for the exploration of contemporary and historical cultures. While digital humanities research has focused on text data, cultural analytics has a particular focus on massive cultural data sets of visual material – both digitized visual artifacts and contemporary visual and interactive media. Taking on the challenge of how to best explore large collections of rich cultural content, cultural analytics researchers developed new methods and intuitive visual techniques that rely on high-resolution visualization and digital image processing. These methods are used to address both the existing research questions in humanities, to explore new questions, and to develop new theoretical concepts that fit the mega-scale of digital culture in the early 21st century.
KNIME, the Konstanz Information Miner, is a free and open-source data analytics, reporting and integration platform. KNIME integrates various components for machine learning and data mining through its modular data pipelining "Building Blocks of Analytics" concept. A graphical user interface and use of JDBC allows assembly of nodes blending different data sources, including preprocessing, for modeling, data analysis and visualization without, or with only minimal, programming.
MeVisLab is a cross-platform application framework for medical image processing and scientific visualization. It includes advanced algorithms for image registration, segmentation, and quantitative morphological and functional image analysis. An IDE for graphical programming and rapid user interface prototyping is available.
Wealth Lab is a technical analysis software as well as an electronic trading platform owned by Fidelity Investments. It was created by Dion Kurczek, who founded the original Wealth-Lab, Inc. corporation in 2000. Fidelity acquired the Wealth-Lab software assets in 2004. The client runs on Microsoft Windows .NET Framework v4.0 and requires internet access to function properly. Licensed users can program and backtest trading strategies for stocks and futures. Fidelity premium account holders can use the platform to place trades produced by their trading strategies directly to their brokerage accounts and even setup auto-trading systems.

RStudio is an integrated development environment for R, a programming language for statistical computing and graphics. It is available in two formats: RStudio Desktop is a regular desktop application while RStudio Server runs on a remote server and allows accessing RStudio using a web browser.

NodeXL is a network analysis and visualization software package for Microsoft Excel 2007/2010/2013/2016. It is a popular package similar to other network visualization tools such as Pajek, UCINet, and Gephi. It is widely applied in ring, mapping of vertex and edge, and customizable visual attributes and tags. It enables researchers to undertake social network analysis work’s metrics such as centrality, degree, and clustering. It allows us to see the relational data and describe the overall relational network structure. When we applied it in Twitter data analysis, it can show the huge network of all users participating in public discussion and its internal structure through big data mining. It permits social Network analysis (SNA) emphasizes the relationships rather than isolated individuals or organizations, so this method allows us to investigate the ‘two-way dialogue between the organization and the public. SNA also provides researchers with a flexible measurement system and parameter selection to confirm the influential nodes in the network, such as in-degree and out-degree centrality. The free version contains network visualization and social network analysis features. The commercial version includes access to social media network data importers, advanced network metrics, and automation.
References
- Schlittgen (2005). Das Statistiklabor – Einführung und Benutzerhandbuch (in German). Berlin, Heidelberg, New York: Springer. ISBN 3-540-22389-4.
- Kladroba (2006). "E-learning in der Statistik – Ein Vergleich verschiedener Lernsoftwareangebote". Allgemeines Statistisches Archiv (in German). 90 (2): 323–340. doi:10.1007/s10182-006-0236-y.