Related Research Articles
In computer science, a memory leak is a type of resource leak that occurs when a computer program incorrectly manages memory allocations in a way that memory which is no longer needed is not released. A memory leak may also happen when an object is stored in memory but cannot be accessed by the running code. A memory leak has symptoms similar to a number of other problems and generally can only be diagnosed by a programmer with access to the program's source code.
Multiple Virtual Storage, more commonly called MVS, was the most commonly used operating system on the System/370 and System/390 IBM mainframe computers. IBM developed MVS, along with OS/VS1 and SVS, as a successor to OS/360. It is unrelated to IBM's other mainframe operating system lines, e.g., VSE, VM, TPF.
In computing, a segmentation fault or access violation is a fault, or failure condition, raised by hardware with memory protection, notifying an operating system (OS) the software has attempted to access a restricted area of memory. On standard x86 computers, this is a form of general protection fault. The operating system kernel will, in response, usually perform some corrective action, generally passing the fault on to the offending process by sending the process a signal. Processes can in some cases install a custom signal handler, allowing them to recover on their own, but otherwise the OS default signal handler is used, generally causing abnormal termination of the process, and sometimes a core dump.

A debugger or debugging tool is a computer program used to test and debug other programs. The main use of a debugger is to run the target program under controlled conditions that permit the programmer to track its operations in progress and monitor changes in computer resources that may indicate malfunctioning code. Typical debugging facilities include the ability to run or halt the target program at specific points, display the contents of memory, CPU registers or storage devices, and modify memory or register contents in order to enter selected test data that might be a cause of faulty program execution.

Memory management is a form of resource management applied to computer memory. The essential requirement of memory management is to provide ways to dynamically allocate portions of memory to programs at their request, and free it for reuse when no longer needed. This is critical to any advanced computer system where more than a single process might be underway at any time.
In computer programming, specifically when using the imperative programming paradigm, an assertion is a predicate connected to a point in the program, that always should evaluate to true at that point in code execution. Assertions can help a programmer read the code, help a compiler compile it, or help the program detect its own defects.

In computing, a crash, or system crash, occurs when a computer program such as a software application or an operating system stops functioning properly and exits. On some operating systems or individual applications, a crash reporting service will report the crash and any details relating to it, usually to the developer(s) of the application. If the program is a critical part of the operating system, the entire system may crash or hang, often resulting in a kernel panic or fatal system error.
In computing, a bus error is a fault raised by hardware, notifying an operating system (OS) that a process is trying to access memory that the CPU cannot physically address: an invalid address for the address bus, hence the name. In modern use on most architectures these are much rarer than segmentation faults, which occur primarily due to memory access violations: problems in the logical address or permissions.
C dynamic memory allocation refers to performing manual memory management for dynamic memory allocation in the C programming language via a group of functions in the C standard library, namely malloc, realloc, calloc and free.
IBM CICS is a family of mixed-language application servers that provide online transaction management and connectivity for applications on IBM mainframe systems under z/OS and z/VSE.
A memory debugger is a debugger for finding software memory problems such as memory leaks and buffer overflows. These are due to bugs related to the allocation and deallocation of dynamic memory. Programs written in languages that have garbage collection, such as managed code, might also need memory debuggers, e.g. for memory leaks due to "living" references in collections.
Memory corruption occurs in a computer program when the contents of a memory location are modified due to programmatic behavior that exceeds the intention of the original programmer or program/language constructs; this is termed violating memory safety. The most likely cause of memory corruption is programming error. When the corrupted memory contents are used later in that program, it leads either to program crash or to strange and bizarre program behavior. Nearly 10% of application crashes on Windows systems are due to heap corruption.
Memory protection is a way to control memory access rights on a computer, and is a part of most modern instruction set architectures and operating systems. The main purpose of memory protection is to prevent a process from accessing memory that has not been allocated to it. This prevents a bug or malware within a process from affecting other processes, or the operating system itself. Protection may encompass all accesses to a specified area of memory, write accesses, or attempts to execute the contents of the area. An attempt to access unauthorized memory results in a hardware fault, e.g., a segmentation fault, storage violation exception, generally causing abnormal termination of the offending process. Memory protection for computer security includes additional techniques such as address space layout randomization and executable space protection.

A general protection fault (GPF) in the x86 instruction set architectures (ISAs) is a fault initiated by ISA-defined protection mechanisms in response to an access violation caused by some running code, either in the kernel or a user program. The mechanism is first described in Intel manuals and datasheets for the Intel 80286 CPU, which was introduced in 1983; it is also described in section 9.8.13 in the Intel 80386 programmer's reference manual from 1986. A general protection fault is implemented as an interrupt. Some operating systems may also classify some exceptions not related to access violations, such as illegal opcode exceptions, as general protection faults, even though they have nothing to do with memory protection. If a CPU detects a protection violation, it stops executing the code and sends a GPF interrupt. In most cases, the operating system removes the failing process from the execution queue, signals the user, and continues executing other processes. If, however, the operating system fails to catch the general protection fault, i.e. another protection violation occurs before the operating system returns from the previous GPF interrupt, the CPU signals a double fault, stopping the operating system. If yet another failure occurs, the CPU is unable to recover; since 80286, the CPU enters a special halt state called "Shutdown", which can only be exited through a hardware reset. The IBM PC AT, the first PC-compatible system to contain an 80286, has hardware that detects the Shutdown state and automatically resets the CPU when it occurs. All descendants of the PC AT do the same, so in a PC, a triple fault causes an immediate system reset.

In software development, a breakpoint is an intentional stopping or pausing place in a program, put in place for debugging purposes. It is also sometimes simply referred to as a pause.
Insure++ is a memory debugger computer program, used by software developers to detect various errors in programs written in C and C++. It is made by Parasoft, and is functionally similar to other memory debuggers, such as Purify, Valgrind and Dr Memory.
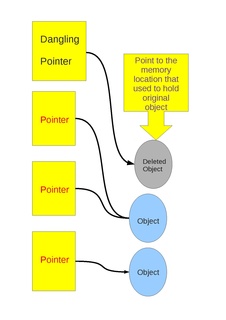
Dangling pointers and wild pointers in computer programming are pointers that do not point to a valid object of the appropriate type. These are special cases of memory safety violations. More generally, dangling references and wild references are references that do not resolve to a valid destination, and include such phenomena as link rot on the internet.
Dynamic program analysis is the analysis of computer software that is performed by executing programs on a real or virtual processor. For dynamic program analysis to be effective, the target program must be executed with sufficient test inputs to cover almost all possible outputs. Use of software testing measures such as code coverage helps ensure that an adequate slice of the program's set of possible behaviors has been observed. Also, care must be taken to minimize the effect that instrumentation has on the execution of the target program. Dynamic analysis is in contrast to static program analysis. Unit tests, integration tests, system tests and acceptance tests use dynamic testing.
CA-EZTEST was a CICS interactive test/debug software package distributed by Computer Associates and originally called EZTEST/CICS, produced by Capex Corporation of Phoenix, Arizona with assistance from Ken Dakin from England.
In computer programming and software development, debugging is the process of finding and resolving bugs within computer programs, software, or systems.
References
- ↑ "Debug Malloc Library". Dmalloc - Debug Malloc Library. Retrieved 2017-04-26.
- IBM. "CICS Transaction Server for z/OS, Version 3 Release 2 Information Center". IBM. Retrieved 2008-10-20.
- CICS problem determination Guide