
El Niño–Southern Oscillation (ENSO) is a global climate phenomenon that emerges from variations in winds and sea surface temperatures over the tropical Pacific Ocean. Those variations have an irregular pattern but do have some semblance of cycles. The occurrence of ENSO is not predictable. It affects the climate of much of the tropics and subtropics, and has links (teleconnections) to higher-latitude regions of the world. The warming phase of the sea surface temperature is known as El Niño and the cooling phase as La Niña. The Southern Oscillation is the accompanying atmospheric oscillation, which is coupled with the sea temperature change.

The Pacific decadal oscillation (PDO) is a robust, recurring pattern of ocean-atmosphere climate variability centered over the mid-latitude Pacific basin. The PDO is detected as warm or cool surface waters in the Pacific Ocean, north of 20°N. Over the past century, the amplitude of this climate pattern has varied irregularly at interannual-to-interdecadal time scales. There is evidence of reversals in the prevailing polarity of the oscillation occurring around 1925, 1947, and 1977; the last two reversals corresponded with dramatic shifts in salmon production regimes in the North Pacific Ocean. This climate pattern also affects coastal sea and continental surface air temperatures from Alaska to California.
The South Pacific Convergence Zone (SPCZ), a reverse-oriented monsoon trough, is a band of low-level convergence, cloudiness and precipitation extending from the Western Pacific Warm Pool at the maritime continent south-eastwards towards French Polynesia and as far as the Cook Islands. The SPCZ is a portion of the Intertropical Convergence Zone (ITCZ) which lies in a band extending east–west near the Equator but can be more extratropical in nature, especially east of the International Date Line. It is considered the largest and most important piece of the ITCZ, and has the least dependence upon heating from a nearby landmass during the summer than any other portion of the monsoon trough. The SPCZ can affect the precipitation on Polynesian islands in the southwest Pacific Ocean, so it is important to understand how the SPCZ behaves with large-scale, global climate phenomenon, such as the ITCZ, El Niño–Southern Oscillation, and the Interdecadal Pacific oscillation (IPO), a portion of the Pacific decadal oscillation.

The Madden–Julian oscillation (MJO) is the largest element of the intraseasonal variability in the tropical atmosphere. It was discovered in 1971 by Roland Madden and Paul Julian of the American National Center for Atmospheric Research (NCAR). It is a large-scale coupling between atmospheric circulation and tropical deep atmospheric convection. Unlike a standing pattern like the El Niño–Southern Oscillation (ENSO), the Madden–Julian oscillation is a traveling pattern that propagates eastward, at approximately 4 to 8 m/s, through the atmosphere above the warm parts of the Indian and Pacific oceans. This overall circulation pattern manifests itself most clearly as anomalous rainfall.

The geography of South America contains many diverse regions and climates. Geographically, South America is generally considered a continent forming the southern portion of the landmass of the Americas, south and east of the Colombia–Panama border by most authorities, or south and east of the Panama Canal by some. South and North America are sometimes considered a single continent or supercontinent, while constituent regions are infrequently considered subcontinents.
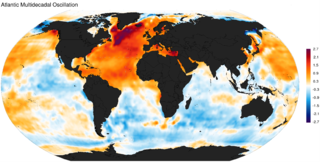
The Atlantic Multidecadal Oscillation (AMO), also known as Atlantic Multidecadal Variability (AMV), is the theorized variability of the sea surface temperature (SST) of the North Atlantic Ocean on the timescale of several decades.

The Indian Ocean Dipole (IOD), also known as the Indian Niño, is an irregular oscillation of sea surface temperatures in which the western Indian Ocean becomes alternately warmer and then colder than the eastern part of the ocean.

The Pacific–North American teleconnection pattern (PNA) is a large-scale weather pattern with two modes, denoted positive and negative, and which relates the atmospheric circulation pattern over the North Pacific Ocean with the one over the North American continent. It is the second leading mode of natural climate variability in the higher latitudes of the Northern Hemisphere and can be diagnosed using the arrangement of anomalous geopotential heights or air pressures over the North Pacific and North America.

The South Atlantic convergence zone, or SACZ, is an elongated axis of clouds, precipitation, and convergent winds oriented in a northwest–southeast manner across southeast Brazil into the southwest Atlantic Ocean. By definition, the feature is a monsoon trough. It is strongest in the warm season. Thunderstorm activity along the feature magnifies over three or more days when the Madden–Julian oscillation passes into the region, due to the enhanced upper divergence. Low level winds over Rondônia are tied to the strength of this zone, where westerly wind anomalies correlate to active phases of the South American monsoon, while easterly wind anomalies indicate breaks of activity along the SACZ. The feature is also strongest with negative anomalies in the sea surface temperature pattern lie over the southern Atlantic Ocean, while opposite conditions prevail across the northern Atlantic Ocean.
The Arctic dipole anomaly is a pressure pattern characterized by high pressure on the arctic regions of North America and low pressure on those of Eurasia. This pattern sometimes replaces the Arctic oscillation and the North Atlantic oscillation. It was observed for the first time in the first decade of 2000s and is perhaps linked to recent climate change. The Arctic dipole lets more southern winds into the Arctic Ocean resulting in more ice melting. The summer 2007 event played an important role in the record low sea ice extent which was recorded in September. The Arctic dipole has also been linked to changes in arctic circulation patterns that cause drier winters in Northern Europe, but much wetter winters in Southern Europe and colder winters in East Asia, Europe and the eastern half of North America.

The Monsoon of South Asia is among several geographically distributed global monsoons. It affects the Indian subcontinent, where it is one of the oldest and most anticipated weather phenomena and an economically important pattern every year from June through September, but it is only partly understood and notoriously difficult to predict. Several theories have been proposed to explain the origin, process, strength, variability, distribution, and general vagaries of the monsoon, but understanding and predictability are still evolving.
The Atlantic Equatorial Mode or Atlantic Niño is a quasiperiodic interannual climate pattern of the equatorial Atlantic Ocean. It is the dominant mode of year-to-year variability that results in alternating warming and cooling episodes of sea surface temperatures accompanied by changes in atmospheric circulation. The term Atlantic Niño comes from its close similarity with the El Niño-Southern Oscillation (ENSO) that dominates the tropical Pacific basin. For this reason, the Atlantic Niño is often called the little brother of El Niño. The Atlantic Niño usually appears in northern summer, and is not the same as the Atlantic Meridional (Interhemispheric) Mode that consists of a north-south dipole across the equator and operates more during northern spring. The equatorial warming and cooling events associated with the Atlantic Niño are known to be strongly related to rainfall variability over the surrounding continents, especially in West African countries bordering the Gulf of Guinea. Therefore, understanding of the Atlantic Niño has important implications for climate prediction in those regions. Although the Atlantic Niño is an intrinsic mode to the equatorial Atlantic, there may be a tenuous causal relationship between ENSO and the Atlantic Niño in some circumstances.

The Barrier layer in the ocean is a layer of water separating the well-mixed surface layer from the thermocline.
The Tropical Atlantic SST Dipole refers to a cross-equatorial sea surface temperature (SST) pattern that appears dominant on decadal timescales. It has a period of about 12 years, with the SST anomalies manifesting their most pronounced features around 10–15 degrees of latitude off of the Equator. It is also referred to as the interhemispheric SST gradient or the Meridional Atlantic mode.
The Tropical Atlantic Variability (TAV) is influenced by internal interaction and external effects. TAV can be discussed in different time scales: seasonal and interannual. tav can be discussed in different time scales:seasonal and interannual.and external effects.

Pacific Meridional Mode (PMM) is a climate mode in the North Pacific. In its positive state, it is characterized by the coupling of weaker trade winds in the northeast Pacific Ocean between Hawaii and Baja California with decreased evaporation over the ocean, thus increasing sea surface temperatures (SST); and the reverse during its negative state. This coupling develops during the winter months and spreads southwestward towards the equator and the central and western Pacific during spring, until it reaches the Intertropical Convergence Zone (ITCZ), which tends to shift north in response to a positive PMM.
Ocean dynamical thermostat is a physical mechanism through which changes in the mean radiative forcing influence the gradients of sea surface temperatures in the Pacific Ocean and the strength of the Walker circulation. Increased radiative forcing (warming) is more effective in the western Pacific than in the eastern where the upwelling of cold water masses damps the temperature change. This increases the east-west temperature gradient and strengthens the Walker circulation. Decreased radiative forcing (cooling) has the opposite effect.

The Australian Northwest Cloudband (NWCB), or just Northwest cloudband, is a band of a broad, continuous, moisture-laden cloud that stretches from the tropical east Indian Ocean to southern Australia, which would form in the cool season and may generally bring sporadic precipitation across the Australian continent. The NWCB is the third most commonly occurring cloudband in the world and the fourth most frequently occurring cloudband in the Southern Hemisphere.
The Rodwell–Hoskins mechanism is a hypothesis describing a climatic teleconnection between the Indian/Asian summer monsoon and the climate of the Mediterranean. It was formulated in 1996 by Brian Hoskins and Mark J. Rodwell [d]. The hypothesis stipulates that ascending air in the monsoon region induces atmospheric circulation features named Rossby waves that expand westward and interact with the mean westerly winds of the midlatitudes, eventually inducing descent of the air. Descending air warms and its humidity decreases, thus resulting in a drier climate during the summer months. The interaction of this atmospheric flow with topography further modifies the effect.

The 2020–2023 La Niña event was a rare three-year, triple-dip La Niña. The impact of the event led to numerous natural disasters that were either sparked or fueled by the La Niña. La Niña refers to the reduction in the temperature of the ocean surface across the central and eastern equatorial Pacific, accompanied by notable changes in the tropical atmospheric circulation. This includes alterations in wind patterns, pressure, and rainfall. The cold phase of the El Niño Southern Oscillation (ENSO), known as La Niña, typically produces contrasting effects on weather and climate compared to El Niño, which is the warm phase of the same phenomenon.

