Bioinformatics is an interdisciplinary field that develops methods and software tools for understanding biological data, in particular when the data sets are large and complex. As an interdisciplinary field of science, bioinformatics combines biology, computer science, information engineering, mathematics and statistics to analyze and interpret the biological data. Bioinformatics has been used for in silico analyses of biological queries using mathematical and statistical techniques.

Graph drawing is an area of mathematics and computer science combining methods from geometric graph theory and information visualization to derive two-dimensional depictions of graphs arising from applications such as social network analysis, cartography, linguistics, and bioinformatics.
DOT is a graph description language. DOT graphs are typically files with the filename extension gv or dot. The extension gv is preferred, to avoid confusion with the extension dot used by versions of Microsoft Word before 2007.
Modelling biological systems is a significant task of systems biology and mathematical biology. Computational systems biology aims to develop and use efficient algorithms, data structures, visualization and communication tools with the goal of computer modelling of biological systems. It involves the use of computer simulations of biological systems, including cellular subsystems, to both analyze and visualize the complex connections of these cellular processes.

Metabolic network reconstruction and simulation allows for an in-depth insight into the molecular mechanisms of a particular organism. In particular, these models correlate the genome with molecular physiology. A reconstruction breaks down metabolic pathways into their respective reactions and enzymes, and analyzes them within the perspective of the entire network. In simplified terms, a reconstruction collects all of the relevant metabolic information of an organism and compiles it in a mathematical model. Validation and analysis of reconstructions can allow identification of key features of metabolism such as growth yield, resource distribution, network robustness, and gene essentiality. This knowledge can then be applied to create novel biotechnology.
Graph Modeling Language (GML) is a hierarchical ASCII-based file format for describing graphs. It has been also named Graph Meta Language.
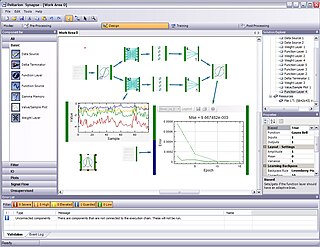
Synapse is a component-based development environment for neural networks and adaptive systems. Created by Peltarion, Synapse allows data mining, statistical analysis, visualization, preprocessing, design and training of neural networks and adaptive systems and the deployment of them. It utilizes a plug-in based architecture making it a general platform for signal processing. The first version of the product was released in May 2006.
The Systems Biology Markup Language (SBML) is a representation format, based on XML, for communicating and storing computational models of biological processes. It is a free and open standard with widespread software support and a community of users and developers. SBML can represent many different classes of biological phenomena, including metabolic networks, cell signaling pathways, regulatory networks, infectious diseases, and many others. It has been proposed as a standard for representing computational models in systems biology today.
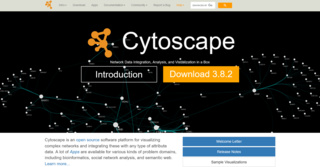
Cytoscape is an open source bioinformatics software platform for visualizing molecular interaction networks and integrating with gene expression profiles and other state data. Additional features are available as plugins. Plugins are available for network and molecular profiling analyses, new layouts, additional file format support and connection with databases and searching in large networks. Plugins may be developed using the Cytoscape open Java software architecture by anyone and plugin community development is encouraged. Cytoscape also has a JavaScript-centric sister project named Cytoscape.js that can be used to analyse and visualise graphs in JavaScript environments, like a browser.

JUNG is an open-source graph modeling and visualization framework written in Java, under the BSD license. The framework comes with a number of layout algorithms built in, as well as analysis algorithms such as graph clustering and metrics for node centrality.
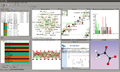
Eye-Sys is a general-purpose commercial visualization application. It was developed by Interactive Data Visualization, Inc. (IDV), developers of the SpeedTree video game middleware. Eye-Sys development was partially funded by the U.S. Navy's Small Business Innovation Research (SBIR) program, and guided and administered by the Joint Warfare Analysis Center (JWAC).
BioPAX is a RDF/OWL-based standard language to represent biological pathways at the molecular and cellular level. Its major use is to facilitate the exchange of pathway data. Pathway data captures our understanding of biological processes, but its rapid growth necessitates development of databases and computational tools to aid interpretation. However, the current fragmentation of pathway information across many databases with incompatible formats presents barriers to its effective use. BioPAX solves this problem by making pathway data substantially easier to collect, index, interpret and share. BioPAX can represent metabolic and signaling pathways, molecular and genetic interactions and gene regulation networks. BioPAX was created through a community process. Through BioPAX, millions of interactions organized into thousands of pathways across many organisms, from a growing number of sources, are available. Thus, large amounts of pathway data are available in a computable form to support visualization, analysis and biological discovery.

Strand Life Sciences, formerly Strand Genomics, is a Bengaluru, India-based in silico technology company. Strand focuses in data mining, predictive modeling, computational chemistry, software engineering, bioinformatics, and research biology to develop software and services for life sciences research. Strand also offers custom solutions based on its intellectual property. In August 2007, Strand and Agilent Technologies, Inc. entered an agreement in which Strand develops and supports Agilent's GeneSpring software which Agilent obtained through Silicon Genetics acquisition in August 2004. In October 2010, Strand and Agilent renewed the agreement for Strand to expand the scope of Agilent's GeneSpring across multiple life sciences disciplines.
The ConsensusPathDB is a molecular functional interaction database, integrating information on protein interactions, genetic interactions signaling, metabolism, gene regulation, and drug-target interactions in humans. ConsensusPathDB currently includes such interactions from 32 databases. ConsensusPathDB is freely available for academic use under http://ConsensusPathDB.org.

GIMIAS is a workflow-oriented environment focused on biomedical image computing and simulation. The open-source framework is extensible through plug-ins and is focused on building research and clinical software prototypes. Gimias has been used to develop clinical prototypes in the fields of cardiac imaging and simulation, angiography imaging and simulation, and neurology
COPASI is an open-source software application for creating and solving mathematical models of biological processes such as metabolic networks, cell-signaling pathways, regulatory networks, infectious diseases, and many others.
Virtual Cell (VCell) is an open-source software platform for modeling and simulation of living organisms, primarily cells. It has been designed to be a tool for a wide range of scientists, from experimental cell biologists to theoretical biophysicists.

NetMiner is an application software for exploratory analysis and visualization of large network data based on SNA(Social Network Analysis). It can be used for general research and teaching in social networks. This tool allows researchers to explore their network data visually and interactively, helps them to detect underlying patterns and structures of the network. It features data transformation, network analysis, statistics, visualization of network data, chart, and a programming language based on the Python script language. Also, it enables users to import unstructured text data(e.g. news, articles, tweets, etc.) and extract words and network from text data. In addition, NetMiner SNS Data Collector, an extension of NetMiner, can collect some social networking service(SNS) data with a few clicks.

NodeXL is a network analysis and visualization software package for Microsoft Excel 2007/2010/2013/2016. The free version contains network visualization and social network analysis features. The commercial version includes access to social media network data importers, advanced network metrics, and automation. It is a popular package similar to other network visualization tools such as Pajek, UCINet, and Gephi..
The Science of Science (Sci2) Tool is a modular toolset specifically designed for the study of science. It supports the temporal, geospatial, topical, and network analysis and visualization of datasets at the micro (individual), meso (local), and macro (global) levels. Users of the tool can: