In statistics, stratified sampling is a method of sampling from a population which can be partitioned into subpopulations.
Factor analysis is a statistical method used to describe variability among observed, correlated variables in terms of a potentially lower number of unobserved variables called factors. For example, it is possible that variations in six observed variables mainly reflect the variations in two unobserved (underlying) variables. Factor analysis searches for such joint variations in response to unobserved latent variables. The observed variables are modelled as linear combinations of the potential factors plus "error" terms, hence factor analysis can be thought of as a special case of errors-in-variables models.

In mathematics, deconvolution is the operation inverse to convolution. Both operations are used in signal processing and image processing. For example, it may be possible to recover the original signal after a filter (convolution) by using a deconvolution method with a certain degree of accuracy. Due to the measurement error of the recorded signal or image, it can be demonstrated that the worse the signal-to-noise ratio (SNR), the worse the reversing of a filter will be; hence, inverting a filter is not always a good solution as the error amplifies. Deconvolution offers a solution to this problem.
Source lines of code (SLOC), also known as lines of code (LOC), is a software metric used to measure the size of a computer program by counting the number of lines in the text of the program's source code. SLOC is typically used to predict the amount of effort that will be required to develop a program, as well as to estimate programming productivity or maintainability once the software is produced.

In statistics, originally in geostatistics, kriging or Kriging, also known as Gaussian process regression, is a method of interpolation based on Gaussian process governed by prior covariances. Under suitable assumptions of the prior, kriging gives the best linear unbiased prediction (BLUP) at unsampled locations. Interpolating methods based on other criteria such as smoothness may not yield the BLUP. The method is widely used in the domain of spatial analysis and computer experiments. The technique is also known as Wiener–Kolmogorov prediction, after Norbert Wiener and Andrey Kolmogorov.
This glossary of statistics and probability is a list of definitions of terms and concepts used in the mathematical sciences of statistics and probability, their sub-disciplines, and related fields. For additional related terms, see Glossary of mathematics and Glossary of experimental design.

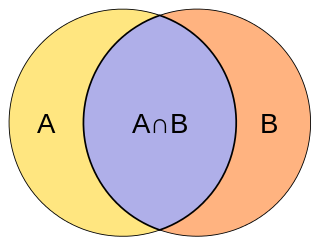
The Jaccard index, also known as the Jaccard similarity coefficient, is a statistic used for gauging the similarity and diversity of sample sets.
Robust statistics are statistics which maintain their properties even if the underlying distributional assumptions are incorrect. Robust statistical methods have been developed for many common problems, such as estimating location, scale, and regression parameters. One motivation is to produce statistical methods that are not unduly affected by outliers. Another motivation is to provide methods with good performance when there are small departures from a parametric distribution. For example, robust methods work well for mixtures of two normal distributions with different standard deviations; under this model, non-robust methods like a t-test work poorly.
In statistics, a generalized additive model (GAM) is a generalized linear model in which the linear response variable depends linearly on unknown smooth functions of some predictor variables, and interest focuses on inference about these smooth functions.
SEER for Software (SEER-SEM) is a project management application used to estimate resources required for software development.
Nanoindentation, also called instrumented indentation testing, is a variety of indentation hardness tests applied to small volumes. Indentation is perhaps the most commonly applied means of testing the mechanical properties of materials. The nanoindentation technique was developed in the mid-1970s to measure the hardness of small volumes of material.
The function point is a "unit of measurement" to express the amount of business functionality an information system provides to a user. Function points are used to compute a functional size measurement (FSM) of software. The cost of a single unit is calculated from past projects.
A mixed model, mixed-effects model or mixed error-component model is a statistical model containing both fixed effects and random effects. These models are useful in a wide variety of disciplines in the physical, biological and social sciences. They are particularly useful in settings where repeated measurements are made on the same statistical units, or where measurements are made on clusters of related statistical units. Mixed models are often preferred over traditional analysis of variance regression models because of their flexibility in dealing with missing values and uneven spacing of repeated measurements.The Mixed model analysis allows measurements to be explicitly modeled in a wider variety of correlation and variance-covariance structures.
Bootstrapping is any test or metric that uses random sampling with replacement, and falls under the broader class of resampling methods. Bootstrapping assigns measures of accuracy to sample estimates. This technique allows estimation of the sampling distribution of almost any statistic using random sampling methods.
Software sizing or software size estimation is an activity in software engineering that is used to determine or estimate the size of a software application or component in order to be able to implement other software project management activities. Size is an inherent characteristic of a piece of software just like weight is an inherent characteristic of a tangible material.

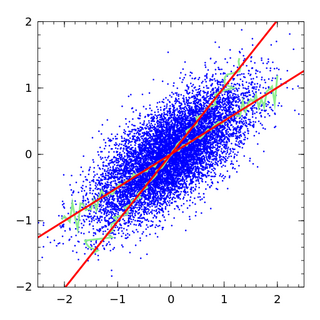
In statistics, errors-in-variables models or measurement error models are regression models that account for measurement errors in the independent variables. In contrast, standard regression models assume that those regressors have been measured exactly, or observed without error; as such, those models account only for errors in the dependent variables, or responses.
The MK II Method is one of the software sizing methods in functional point group of measurements. This is a method for analysis and measurement of information processing applications based on end user functional view of the system. The MK II Method is one of five currently recognized ISO standards for Functionally sizing software.
Electronic systems’ power consumption has been a real challenge for Hardware and Software designers as well as users especially in portable devices like cell phones and laptop computers. Power consumption also has been an issue for many industries that use computer systems heavily such as Internet service providers using servers or companies with many employees using computers and other computational devices. Many different approaches have been discovered by researchers to estimate power consumption efficiently. This survey paper focuses on the different methods where power consumption can be estimated or measured in real-time.
SNAP is the acronym for "Software Non-functional Assessment Process," a measurement of the size of the software derived by quantifying the non-functional user requirements for the software. The SNAP sizing method complements ISO/IEC 20926:2009, which defines a method for the sizing of functional software user requirements. SNAP is a product of the International Function Point Users Group (IFPUG), and is sized using the “Software Non-functional Assessment Process (SNAP) Assessment Practices Manual” (APM) now in version 2.4. Reference “IEEE 2430-2019-IEEE Trial-Use Standard for Non-Functional Sizing Measurements,” published October 19, 2019. Also reference ISO standard “Software engineering — Trial use standard for software non-functional sizing measurements,”, published October 2021. For more information about SNAP please visit YouTube and search for "IFPUG SNAP;" this will provide a series of videos overviewing the SNAP methodology.
COSMIC functional size measurement is a method to measure a standard functional size of a piece of software. COSMIC is an acronym of COmmon Software Measurement International Consortium, a voluntary organization that has developed the method and is still expanding its use to more software domains.


![Comparison of sizes expressed in Unadjusted Function Points (UFP) and Simple Function Points (SiFP) for an ISBSG dataset. The blue line represents perfect equivalence
S
i
z
e
[
S
i
F
P
]
=
S
i
z
e
[
U
F
P
]
{\displaystyle Size_{[SiFP]}=Size_{[UFP]}}
. UFP SiFP IWSM 2014.png](http://upload.wikimedia.org/wikipedia/commons/thumb/c/cc/UFP_SiFP_IWSM_2014.png/330px-UFP_SiFP_IWSM_2014.png)


