An allele is a variant form of a given gene, meaning it is one of two or more versions of a known mutation at the same place on a chromosome. It can also refer to different sequence variations for a several-hundred base-pair or more region of the genome that codes for a protein. Alleles can come in different extremes of size. At the lowest possible end one can be the single base choice of a single nucleotide polymorphism (SNP). At the higher end, it can be the sequence variations for the regions of the genome that code for the same protein which can be up to several thousand base-pairs long.
Biostatistics are the development and application of statistical methods to a wide range of topics in biology. It encompasses the design of biological experiments, the collection and analysis of data from those experiments and the interpretation of the results.

Genetics is a branch of biology concerned with the study of genes, genetic variation, and heredity in organisms.
A genotype is an organism’s complete set of heritable genes, or genes that can be passed down from parents to offspring. These genes help encode the characteristics that are physically expressed (phenotype) in an organism, such as hair color, height, etc. The term was coined by the Danish botanist, plant physiologist and geneticist Wilhelm Johannsen in 1903.

Mendelian inheritance is a type of biological inheritance that follows the principles originally proposed by Gregor Mendel in 1865 and 1866, re-discovered in 1900 and popularized by William Bateson. These principles were initially controversial. When Mendel's theories were integrated with the Boveri–Sutton chromosome theory of inheritance by Thomas Hunt Morgan in 1915, they became the core of classical genetics. Ronald Fisher combined these ideas with the theory of natural selection in his 1930 book The Genetical Theory of Natural Selection, putting evolution onto a mathematical footing and forming the basis for population genetics within the modern evolutionary synthesis.
A phenotypic trait, simply trait, or character state is a distinct variant of a phenotypic characteristic of an organism; it may be either inherited or determined environmentally, but typically occurs as a combination of the two. For example, eye color is a character of an organism, while blue, brown and hazel are traits.

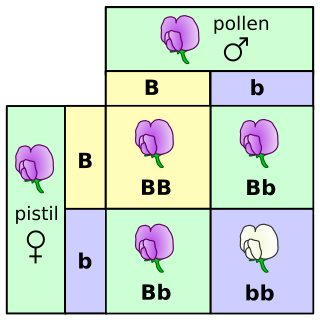
In genetics, dominance is the phenomenon of one variant (allele) of a gene on a chromosome masking or overriding the effect of a different variant of the same gene on the other copy of the chromosome. The first variant is termed dominant and the second recessive. This state of having two different variants of the same gene on each chromosome is originally caused by a mutation in one of the genes, either new or inherited. The terms autosomal dominant or autosomal recessive are used to describe gene variants on non-sex chromosomes (autosomes) and their associated traits, while those on sex chromosomes (allosomes) are termed X-linked dominant, X-linked recessive or Y-linked; these have an inheritance and presentation pattern that depends on the sex of both the parent and the child. Since there is only one copy of the Y chromosome, Y-linked traits cannot be dominant nor recessive. Additionally, there are other forms of dominance such as incomplete dominance, in which a gene variant has a partial effect compared to when it is present on both chromosomes, and co-dominance, in which different variants on each chromosome both show their associated traits.

A decision tree is a decision support tool that uses a tree-like model of decisions and their possible consequences, including chance event outcomes, resource costs, and utility. It is one way to display an algorithm that only contains conditional control statements.
Genetic linkage is the tendency of DNA sequences that are close together on a chromosome to be inherited together during the meiosis phase of sexual reproduction. Two genetic markers that are physically near to each other are unlikely to be separated onto different chromatids during chromosomal crossover, and are therefore said to be more linked than markers that are far apart. In other words, the nearer two genes are on a chromosome, the lower the chance of recombination between them, and the more likely they are to be inherited together. Markers on different chromosomes are perfectly unlinked.

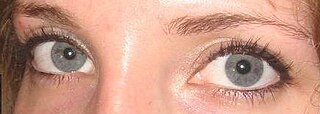
Color vision is an ability of animals to perceive differences between light composed of different wavelengths independently of light intensity. Color perception is a part of the larger visual system and is mediated by a complex process between neurons that begins with differential stimulation of different types of photoreceptors by light entering the eye. Those photoreceptors then emit outputs that are propagated through many layers of neurons and then ultimately to the brain. Color vision is found in many animals and is mediated by similar underlying mechanisms with common types of biological molecules and a complex history of evolution in different animal taxa. In primates, color vision may have evolved under selective pressure for a variety of visual tasks including the foraging for nutritious young leaves, ripe fruit, and flowers, as well as detecting predator camouflage and emotional states in other primates.
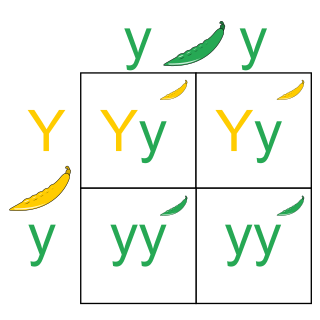
The Punnett square is a square diagram that is used to predict the genotypes of a particular cross or breeding experiment. It is named after Reginald C. Punnett, who devised the approach. The diagram is used by biologists to determine the probability of an offspring having a particular genotype. The Punnett square is a tabular summary of possible combinations of maternal alleles with paternal alleles. These tables can be used to examine the genotypical outcome probabilities of the offspring of a single trait (allele), or when crossing multiple traits from the parents. The Punnett square is a visual representation of Mendelian inheritance. It is important to understand the terms "heterozygous", "homozygous", "double heterozygote", "dominant allele" and "recessive allele" when using the Punnett square method. For multiple traits, using the "forked-line method" is typically much easier than the Punnett square. Phenotypes may be predicted with at least better-than-chance accuracy using a Punnett square, but the phenotype that may appear in the presence of a given genotype can in some instances be influenced by many other factors, as when polygenic inheritance and/or epigenetics are at work.
Cat coat genetics determine the coloration, pattern, length, and texture of feline fur. Understanding how is challenging because many genes are involved. The variations among cat coats are physical properties and should not be confused with cat breeds. A cat may display the coat of a certain breed without actually being that breed. For example, a Siberian could wear point coloration, the stereotypical coat of a Siamese.
A quantitative trait locus (QTL) is a locus that correlates with variation of a quantitative trait in the phenotype of a population of organisms. QTLs are mapped by identifying which molecular markers correlate with an observed trait. This is often an early step in identifying and sequencing the actual genes that cause the trait variation.
The liberal paradox, also Sen paradox or Sen's paradox, is a logical paradox proposed by Amartya Sen which purports to show that no social system can simultaneously
- be committed to a minimal sense of freedom,
- always result in a type of economic efficiency known as Pareto efficiency, and
- be capable of functioning in any society whatsoever.
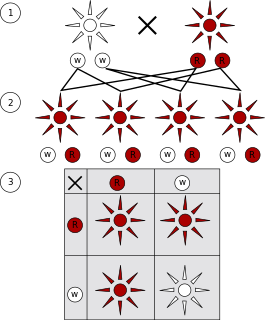
A monohybrid cross is a cross between two organisms with different variations at one genetic chromosome of interest. The character(s) being studied in a monohybrid cross are governed by two or multiple variations for a single locus. A cross between two parents possessing a pair of contrasting characters is known as monohybrid cross. To carry out such a cross, each parent is chosen to be homozygous or true breeding for a given trait (locus). When a cross satisfies the conditions for a monohybrid cross, it is usually detected by a characteristic distribution of second-generation (F2) offspring that is sometimes called the monohybrid ratio.
In genetics, complementation occurs when two strains of an organism with different homozygous recessive mutations that produce the same mutant phenotype have offspring that express the wild-type phenotype when mated or crossed. Complementation will ordinarily occur if the mutations are in different genes. Complementation may also occur if the two mutations are at different sites within the same gene, but this effect is usually weaker than that of intergenic complementation. In the case where the mutations are in different genes, each strain's genome supplies the wild-type allele to "complement" the mutated allele of the other strain's genome. Since the mutations are recessive, the offspring will display the wild-type phenotype. A complementation test can be used to test whether the mutations in two strains are in different genes. Complementation ordinarily will occur more weakly or not at all if the mutations are in the same gene. The convenience and essence of this test is that the mutations that produce a phenotype can be assigned to different genes without the exact knowledge of what the gene product is doing on a molecular level. The complementation test was developed by American geneticist Edward B. Lewis.

In color theory, a color scheme is the choice of colors used in various artistic and design contexts. For example, the "Achromatic" use of a white background with black text is an example of a basic and commonly default color scheme in web design.
Genetics is the study of genes and tries to explain what they are and how they work. Genes are how living organisms inherit features or traits from their ancestors; for example, children usually look like their parents because they have inherited their parents' genes. Genetics tries to identify which traits are inherited, and explain how these traits are passed from generation to generation.

Color psychology is the study of hues as a determinant of human behavior. Color influences perceptions that are not obvious, such as the taste of food. Colors have qualities that can cause certain emotions in people. Colors can also enhance the effectiveness of placebos. For example, red or orange pills are generally used as stimulants. How color influences individuals may differ depending on age, gender, and culture. For instance, heterosexual men tend to report that red outfits enhance female attractiveness, while heterosexual females deny any outfit color impacting that of men. Although color associations can vary contextually between cultures, color preference is to be relatively uniform across gender and race.
Classical genetics is the branch of genetics based solely on visible results of reproductive acts. It is the oldest discipline in the field of genetics, going back to the experiments on Mendelian inheritance by Gregor Mendel who made it possible to identify the basic mechanisms of heredity. Subsequently, these mechanisms have been studied and explained at the molecular level.