Related Research Articles
Fundamental analysis, in accounting and finance, is the analysis of a business's financial statements ; health; competitors and markets. It also considers the overall state of the economy and factors including interest rates, production, earnings, employment, GDP, housing, manufacturing and management. There are two basic approaches that can be used: bottom up analysis and top down analysis. These terms are used to distinguish such analysis from other types of investment analysis, such as quantitative and technical.

A dividend is a distribution of profits by a corporation to its shareholders, after which the stock exchange decreases the price of the stock by the dividend to remove volatility. The market has no control over the stock price on open on the ex-dividend date, though more often than not it may open higher. When a corporation earns a profit or surplus, it is able to pay a portion of the profit as a dividend to shareholders. Any amount not distributed is taken to be re-invested in the business. The current year profit as well as the retained earnings of previous years are available for distribution; a corporation is usually prohibited from paying a dividend out of its capital. Distribution to shareholders may be in cash or, if the corporation has a dividend reinvestment plan, the amount can be paid by the issue of further shares or by share repurchase. In some cases, the distribution may be of assets.
Investment is traditionally defined as the "commitment of resources to achieve later benefits". If an investment involves money, then it can be defined as a "commitment of money to receive more money later". From a broader viewpoint, an investment can be defined as "to tailor the pattern of expenditure and receipt of resources to optimise the desirable patterns of these flows". When expenditures and receipts are defined in terms of money, then the net monetary receipt in a time period is termed cash flow, while money received in a series of several time periods is termed cash flow stream.

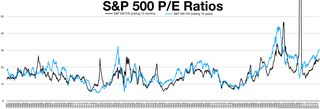
The price–earnings ratio, also known as P/E ratio, P/E, or PER, is the ratio of a company's share (stock) price to the company's earnings per share. The ratio is used for valuing companies and to find out whether they are overvalued or undervalued.
In accounting, book value is the value of an asset according to its balance sheet account balance. For assets, the value is based on the original cost of the asset less any depreciation, amortization or impairment costs made against the asset. Traditionally, a company's book value is its total assets minus intangible assets and liabilities. However, in practice, depending on the source of the calculation, book value may variably include goodwill, intangible assets, or both. The value inherent in its workforce, part of the intellectual capital of a company, is always ignored. When intangible assets and goodwill are explicitly excluded, the metric is often specified to be tangible book value.
The dividend yield or dividend–price ratio of a share is the dividend per share divided by the price per share. It is also a company's total annual dividend payments divided by its market capitalization, assuming the number of shares is constant. It is often expressed as a percentage.
Stock valuation is the method of calculating theoretical values of companies and their stocks. The main use of these methods is to predict future market prices, or more generally, potential market prices, and thus to profit from price movement – stocks that are judged undervalued are bought, while stocks that are judged overvalued are sold, in the expectation that undervalued stocks will overall rise in value, while overvalued stocks will generally decrease in value. A target price is a price at which an analyst believes a stock to be fairly valued relative to its projected and historical earnings.
A financial analyst is a professional undertaking financial analysis for external or internal clients as a core feature of the job. The role may specifically be titled securities analyst, research analyst, equity analyst, investment analyst, or ratings analyst. The job title is a broad one: In banking, and industry more generally, various other analyst-roles cover financial management and (credit) risk management, as opposed to focusing on investments and valuation.
Enterprise value (EV), total enterprise value (TEV), or firm value (FV) is an economic measure reflecting the market value of a business. It is a sum of claims by all claimants: creditors and shareholders. Enterprise value is one of the fundamental metrics used in business valuation, financial analysis, accounting, portfolio analysis, and risk analysis.
Contrarian investing is an investment strategy that is characterized by purchasing and selling in contrast to the prevailing sentiment of the time.
The 'PEG ratio' is a valuation metric for determining the relative trade-off between the price of a stock, the earnings generated per share (EPS), and the company's expected growth.
Earnings per share (EPS) is the monetary value of earnings per outstanding share of common stock for a company during a defined period of time. It is a key measure of corporate profitability, focussing on the interests of the company's owners (shareholders), and is commonly used to price stocks.
In financial reporting, earnings guidance or simply guidance is a publicly traded corporation's official prediction of its own near-future profit or loss, stated as an amount of money per share; see Earnings call. Earnings guidance is usually a financial forecast presented as a quarterly report of the corporation's performance in the next quarter. Guidance is an aid to financial analysts and the stakeholders in valuing the corporation, and helps prevent overvaluation.
The Institutional Brokers' Estimate System (I/B/E/S) is a service founded by the New York brokerage firm Lynch, Jones & Ryan and Technimetrics, Inc. I/B/E/S began collecting earnings estimates for U.S. companies around 1976 and used the raw data to calculate statistical time series for each company. The data subsequently was used as the basis for articles in academic finance journals attempting to demonstrate that changes in consensus earnings estimates could identify opportunities to capture excess returns in subsequent periods. After starting with annual earnings estimates and estimates of "Long Term Growth," the database later was expanded to include quarterly earnings estimates. This allowed for the analysis of "Quarterly Earnings Surprises." Other innovations made possible by the I/B/E/S data included estimates for various equity indexes on a "top down" basis and estimates made on a "bottom up" basis for those same indexes. In the mid-1980s I/B/E/S began to expand its dataset to include companies trading in international markets. Lynch, Jones was sold to Citigroup in 1986. Barra bought I/B/E/S in 1993, selling it to Primark Corp two years later. Thomson Financial purchased Primark in 2000. Successor company Thomson Reuters spun off its financial division under the name Refinitiv in 2018, which itself became a subsidiary of LSEG in Jan 2021.
An earnings call is a teleconference, or webcast, in which a public company discusses the financial results of a reporting period. The name comes from earnings per share (EPS), the bottom line number in the income statement divided by the number of shares outstanding. The US-based National Investor Relations Institute (NIRI) says that 92% of companies represented by their members conduct earnings calls and that virtually all of these are webcast. Transcripts of calls may be made available either by the company or a third party.
Sell side is a term used in the financial services industry to mean providing services to sell securities. Firms or institutions on this side include investment banks, brokerages and market makers, who facilitate offering securities to investors, conducting research and creating financial products.
The price-to-book ratio, or P/B ratio, is a financial ratio used to compare a company's current market value to its book value. The calculation can be performed in two ways, but the result should be the same. In the first way, the company's market capitalization can be divided by the company's total book value from its balance sheet. The second way, using per-share values, is to divide the company's current share price by the book value per share. It is also known as the market-to-book ratio and the price-to-equity ratio, and its inverse is called the book-to-market ratio.
The cyclically adjusted price-to-earnings ratio, commonly known as CAPE, Shiller P/E, or P/E 10 ratio, is a stock valuation measure usually applied to the US S&P 500 equity market. It is defined as price divided by the average of ten years of earnings, adjusted for inflation. As such, it is principally used to assess likely future returns from equities over timescales of 10 to 20 years, with higher than average CAPE values implying lower than average long-term annual average returns.
Phillip Securities Indonesia is a financial services company based in Jakarta, Indonesia. It is listed as a member of Indonesia Stock Exchange.
An earnings surprise, or unexpected earnings, in accounting, is the difference between the reported earnings and the expected earnings of an entity. Measures of a firm's expected earnings, in turn, include analysts' forecasts of the firm's profit and mathematical models of expected earnings based on the earnings of previous accounting periods.
References
- ^ Investopedia. "Whisper Number". Investopedia. Retrieved 2006-04-28.
- ^ Svensson, Daniel (1999-09-23). "He's Whispering Home Run Earnings". Dagens Industri.
- ^ Pulliam, Susan; Pettit, Dave (2000-07-23). "Consider the Source When Evaluating 'Whisper Estimates' on the Internet". Wall Street Journal. Dow Jones.
- ^ Leefeldt, Ed (August 1999). "Whispers That Roar". Bloomberg Magazine.
- ^ Mark Bagnoli; Messod Daniel Beneish; Susan G. Watts (March 1999). "Whisper Forecasts of Quarterly Earnings per Share". Journal of Accounting and Economics.
- ^ "How to Make Earnings Whisper Plays". EarningsWhispers. 2002-01-16.
- ^ "Deckers Outdoor Corporation Reports Record Fourth Quarter Financial Results". Deckers Outdoor. 2008-02-28.
- ^ "The Downtrend is Still Holding". Whisper Report. EarningsWhispers. 2008-02-25.